
The upcoming 2014 growing season appears as though it may offer tighter margins than the last few years. Grain prices look as though they will be much lower and could sink further.
At the same time, input costs and cash rents do not appear to be easing. This could lead to much lower incomes or even losses for some producers in 2014. This makes monitoring a farm’s financial position much more important.
The University of Illinois offers several Microsoft Excel spreadsheets to perform financial and many other types of analysis. Available by clicking here, these tools are free to download and use.
In this article, we will walk through the steps to perform a cash flow analysis using this tool for a grain farm in 2014 based on our budget information (available to view by clicking here). The tool we are going to use is our Monthly Cash Flow Planning program.
The farm
To begin, the user must enter information about each crop (corn, soybeans, wheat and three customizable crops, which can include hay or silage or any other crop), number of acres, expected costs, expected production and rental arrangements.
Our case farm consists of 1,100 acres of corn (300 owned, 300 share rented, 500 cash rented) and 1,100 acres of soybeans (same mixture of rented and owned acres). Expected yields for corn range from 180 to 185 bushels per acre, and soybeans range from 56 to 60 bushels per acre.
Expected crop costs for corn are $367 (cash-rented acres also include a $300-per-acre cash rent). Expected crop costs for soybeans are $189 (cash-rented acres also include a $300-per-acre cash rent).
Next, the program asks the user to allocate payment of the expenses each month throughout the year. And finally, information about who pays each of the expenses for each of the rental agreements needs to be entered.
The next section of the program asks the user for information about price estimates for the upcoming year. In this section, the user will enter expected prices for each quarter for each of the crops, beginning inventory information and crop sale timing information.
In the example, we are using prices ranging from $4.40 to $5 for corn and from $11.20 to $11.50 for soybeans. Beginning inventory in our example includes 100,000 bushels of corn and 30,000 bushels of soybeans.
We have also entered the information about timing of old crop sales and any new crop sold during 2014. This will be used to determine the amount of cash available each month from crop sales.
The final part of this section is used to enter information about checking accounts, operating loans, savings accounts and accrual balances.
The third section of the program is used to enter information about livestock (if the farm has any). It is used to enter price estimates, inventory, sales and purchase information, and feed use and purchases
The case farm does not have any livestock, so this article will not cover this section in detail.
Section four of the program is used to enter information about income and expenses not covered by the crop budget information in the first section, as well as outstanding term loan information and new capital purchases.
In our case, we have additional costs for fuel and oil, hired labor, real estate and property taxes, utilities, farm insurance, machinery and equipment repairs, the farm share of auto costs, building repairs, income and social security taxes, and family living expenditures. This section can also cover additional input expenses.
In the table, the user simply enters a value in the total $ box and then allocates the expense by month throughout the year. Additional income could include other farm receipts, off-farm income and other types of additional revenue.
Our example only includes some off-farm income earned by the farmer’s wife. In this table, simply enter the amount of expected income each month.
There are two options for entering outstanding term loan information. Loans can be entered directly or figured using straight amortization. The direct entry method allows the user to enter all of the information about each loan, including principal and interest payments due each month for the upcoming year.
The straight amortization method allows the user to enter the main details of the loan and the program estimates principal and interest due each month.
The case farm has four term loans, some for machinery and one for a farm. The final part of this section is where the user will record any capital purchases made (if financed, payment schedule information needs to also be entered).
The final input section, section five, is where the user will calculate government program payments (direct and counter-cyclical only). Any other government program payments (CRP, CSP, etc.) would be entered in section four under Government Payments on the Other Income sheet.
Generating reports
The program has several reports that are generated: an overall summary, projected farm cash summary, projected income statement, statement of cash flows, inventory summary, monthly cash flow projections and some additional charts.
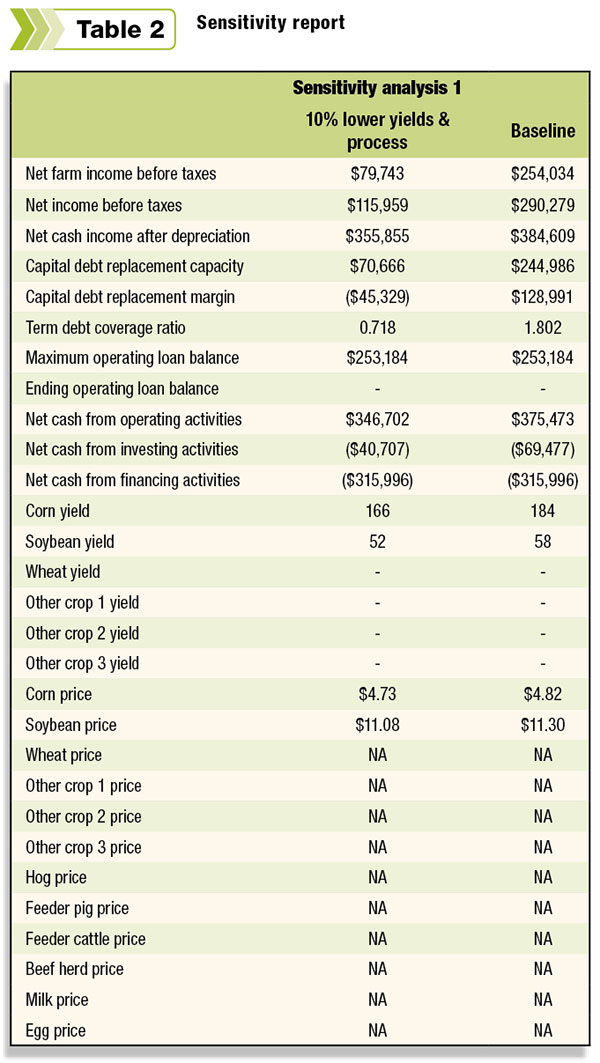
Each of the reports can be viewed and printed. The program also has the ability to do some sensitivity analysis. For example, the user can see how changing prices, yields and expenses impact the farm.
In our example, we project a net farm income before taxes of $290,279. We can also see in the monthly cash flow projection that the maximum balance on the operating note should occur in January at just over $253,000 but will exceed $200,000 a few other times throughout the year.
If we run a scenario in which yields and prices are 10 percent lower than anticipated, net farm income before taxes drops to $79,743. That only drops yields to 166 bushels per acre for corn and 52 bushels per acre for soybeans. And prices only drop to $4.73 for corn and $11.08 for soybeans.
Summary
Monitoring cash flow needs will become very important as margins decrease or even lead to losses. This is especially true for highly leveraged operations and will certainly be what the banker is looking for when considering an operating loan.
While the University of Illinois Monthly Cash Flow Planning program was developed for use by Midwestern grain farms, it has the ability to be expanded to include additional “custom” crops, which can include hay and forage crops as well as various types of livestock.
This tool can be used to project a cash flow statement, calculate projected net farm income, analyze financing needs and perform sensitivity analysis on the results. And best of all – it’s free.


