


The USDA released its latest Ag Prices report on June 30, including factors used to calculate monthly DMC margins and payments. Based on preliminary estimates by Progressive Dairy, the May DMC milk income over feed cost margin is $6.89 per hundredweight (cwt), a nickel decline from April and the fourth straight month in which the margin was below $7 per cwt.
The May margin again triggers indemnity payments on Tier I and Tier II milk insured at all levels above $7 per cwt. Those with Tier I (5 million pounds or less of covered production history) who are insured at the top level of $9.50 per cwt will see a payment of $2.61 per cwt, following payments of $2.56, $3.04 and $3.28 on April, March and February milk marketings, respectively (Table 1).
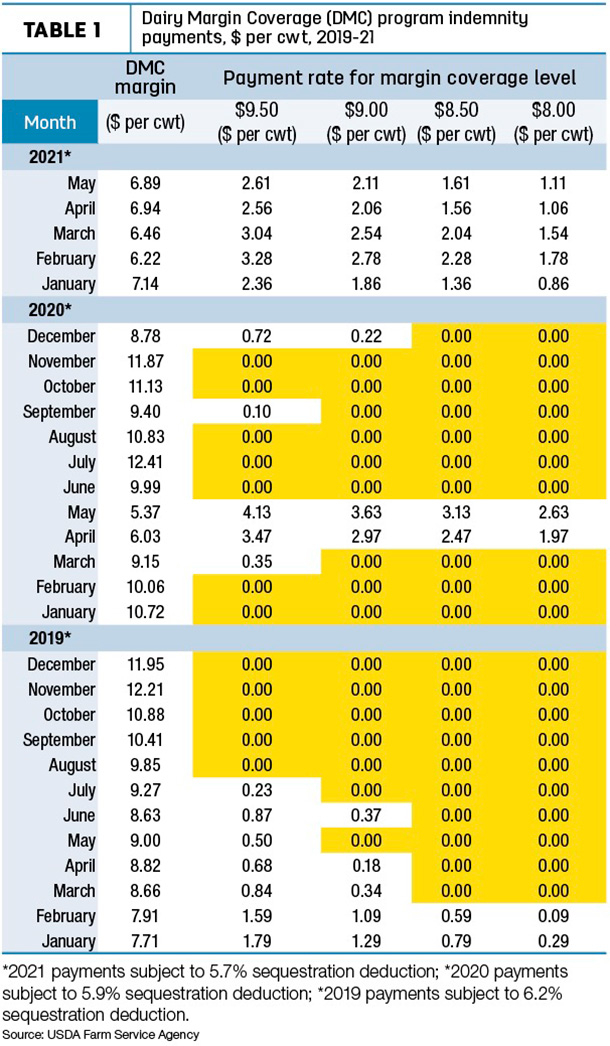
The payments are on one-twelfth of a dairy operation’s covered annual production history, and DMC payments are subject to a 5.7% sequestration deduction in 2021.
Average milk price highest since last November
Under the surface, the small change in the DMC margin doesn’t reflect more dramatic movement in milk and feed prices.
The May 2021 announced U.S. average milk price rose 80 cents from April to $19.20 per cwt, the highest since November 2020. May milk prices were higher than April prices in all 24 major dairy states (Table 2). The biggest increases were in Georgia, Kansas and Virginia, each up $1 or more.
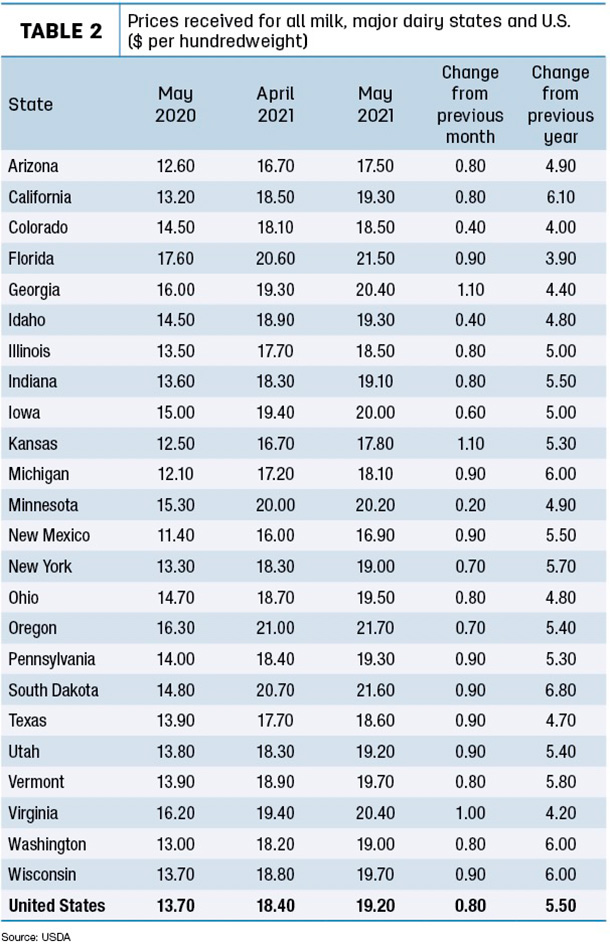
New Mexico had the lowest average milk price in May, $2.30 under the U.S. average. Oregon and Florida were price leaders,at $21.60 and $21.50 per cwt, respectively.
Compared to a year earlier, the U.S. average milk price was up $5.50 per cwt; May year-over-year prices were up $6 or more in California, Michigan, South Dakota, Washington and Wisconsin.
Not included in the all-milk price calculations is the impact of negative producer price differentials (PPDs) on producer milk checks. May PPDs were negative in all seven applicable Federal Milk Marketing Orders (FMMOs), ranging from -$2.23 in the California FMMO to -0.62 in the Northeast FMMO. PPDs have zone differentials, so they’ll vary slightly within each FMMO. In addition, PPD impacts on individual milk checks are based on individual milk handlers. Read: PPDs stay on (negative) trend.
Feed prices post steep increases
On the other side of the ledger, the U.S. average feed cost to produce milk in May was in record territory, at least during the seven-year history of the USDA’s DMC program and its predecessor, the Margin Protection Program for Dairy (MPP-Dairy).
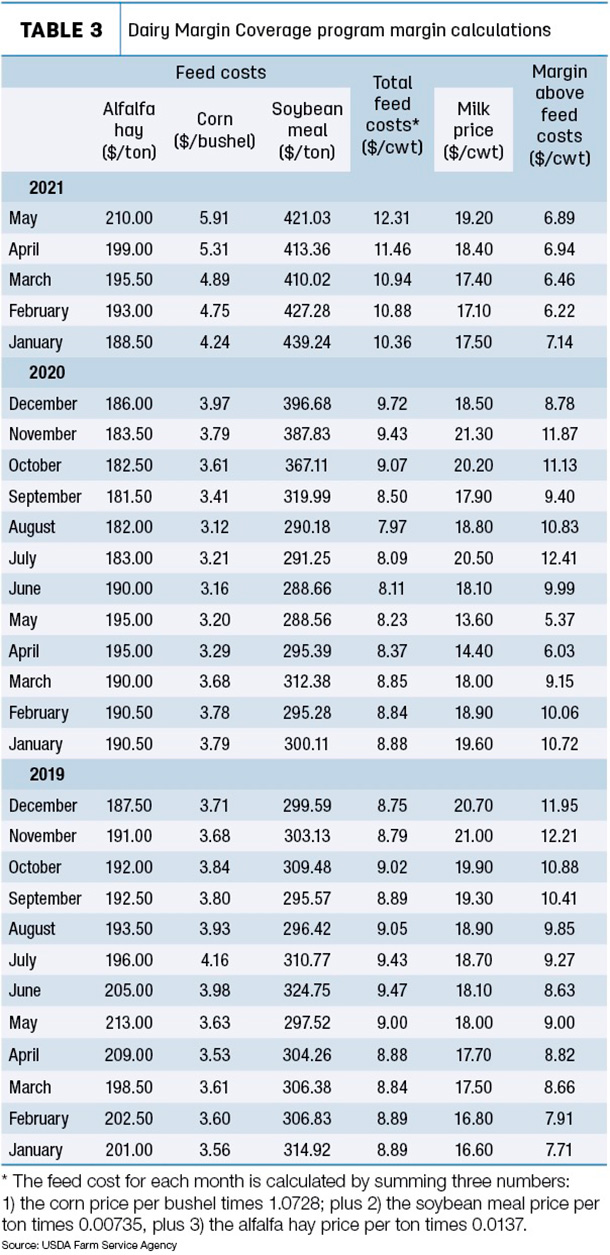
- The average price for a blend of Premium and all alfalfa hay used in DMC calculations was $210 per ton, up $11 per ton from April and the highest since May 2019.
- Compared to a month earlier, the average price for corn jumped another 60 cents to $5.91 per bushel, the highest ever under DMC and MPP-Dairy.
- Soybean meal prices moved to a three-month high in May, up $7.67 to $421.03 per ton, also the third-highest monthly average since December 2014.
Those feedstuff prices yielded an average DMC total feed cost of $12.31 per cwt of milk sold (Table 3), up 85 cents from April and surpassing the previous high of $11.93 per cwt in May 2014 under MPP-Dairy.
Indemnity payment outlook
DMC indemnity payments on May milk marketings will likely total more than $100 million. Through the first four months of 2021, the milk price over feed cost margin had averaged just $6.69 per cwt, and total payments had topped $446 million.
The June 2021 margin and any indemnity payments will be announced on July 30. We already know the June FMMO Class I base price is up $1.19 per cwt from May at $18.29 per cwt. However, the June Class III milk price fell $1.75 to $17.21 per cwt, while the Class IV milk price rose slightly to $16.35 per cwt.
Based on futures prices as of June 29, the DMC Decision Tool indicated monthly average feed costs used in indemnity payment calculations are expected to be about $12 per cwt in June and July, dip to about $11.40 per cwt in August through October and remain above $11 per cwt from November 2021 through July 2022.
However, those estimates were calculated before factoring in the market impact of USDA’s Acreage and Grain Stocks reports released earlier in the day (see below). Both corn and soybean meal futures prices moved higher on the heels of those reports. In addition, the USDA Acreage report indicated a further cut in dry hay acreage in 2021, which could affect supply and prices.
More payments coming?
Additional DMC payments for some producers could be coming soon. On June 15, U.S. Ag Secretary Tom Vilsack said USDA pandemic financial assistance programs would be implemented within 60 days. Among those, was mention of supplemental DMC payments for small and medium producers, a provision approved in last December’s COVID-19 relief bill. According to the USDA, the outlay for the supplemental DMC payments is approximately $580 million.
While details were not provided by Vilsack, the COVID-19 relief bill included language directing the USDA to allow smaller dairy producers to update their milk production history baselines and receive a supplemental DMC payment on a portion of any increased milk production, up to the Tier I cap of 5 million pounds of milk per year.
Read: Weekly Digest: DMC supplemental payments, other dairy aid on a timeline.
USDA reports provide crop market direction
The USDA’s National Agricultural Statistics Service (NASS) released its June Acreage report and quarterly Grain Stocks report on June 30.
Corn planted area for all purposes in 2021 was estimated at 92.7 million acres, up 2% from last year. Forecast area harvested for grain at 84.5 million acres is also up 2% from last year.
Soybean planted area for 2021 was estimated at 87.6 million acres, up 5% from last year.
Looking at the Grain Stocks report, corn inventories totaled 4.11 billion bushels, down 18% from the same time last year. On-farm corn stocks were down 39% from a year ago, but off-farm stocks were up 11%.
Soybean inventories totaled 767 million bushels, down 44% from June 1, 2020. On-farm soybean stocks were down 65% from a year ago, while off-farm stocks were down 27%.
NASS surveyed more than 90,000 farm operators during the first two weeks of June to gather information on planted acreage.
Among other details, the Acreage report estimated 93% of all corn acres planted were biotech varieties, while soybean acreage using herbicide-resistant seed varieties represented 95% of total soybean acreage. Both were up 1% from a year ago.
The USDA’s 2021 Acreage report made further cuts in anticipated dry hay acreage for 2021. Acreage devoted to all hay in 2021 was estimated at 51.537 million acres, down about 177,000 acres from the USDA’s Prospective Plantings report released in late March.
For more, read 2021 hay acreage estimate reduced.


