The use of beef sires on dairy cows and right-sizing heifer inventories have been some of the most sweeping changes on dairy farms in recent years.

Now that many of these changes have been implemented, it is worthwhile to spend a minute and think about how they might impact your future dairy herd.
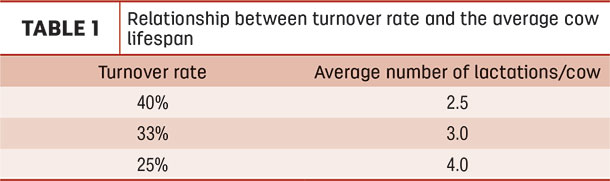
The obvious impact is: As you raise fewer replacement heifers, the turnover rate of your herd will likely decline. The turnover rate of your herd determines the average age of the cows in your herd. As turnover rates decline, the average age of your herd increases.
Relationship between turnover rate and the average cow lifespan
Managing a herd made up of 40% first-lactation cows is different than managing a herd where 35% of the cows are fourth-lactation or greater. As the average age of your herd increases, achieving production goals will be easier, but you will have more challenges in keeping cows healthy and keeping days open at reasonable levels. Management changes that impact the size of your heifer inventory should also include a review of your genetic selection strategy.
Your selection index is the primary tool for implementing your genetic strategy. Reviewing this periodically is a crucial part of planning your dairy’s future. Considering the herd demographic changes that are coming, shifting to more emphasis on direct selection of health traits should be seriously considered.
Another reason to consider more direct emphasis on health traits is that they typically have an unfavorable genetic relationship to production traits. As we select for more productive cattle, we unintentionally are breeding for cattle less resistant to disease. Like what we learned with fertility traits over the course of the last several decades, a similar situation exists with health traits.
Fortunately, we’ve had indirect genetic evaluations for health traits by selecting for things like Productive Life (PL) and Somatic Cell Score (SCS) that have allowed us to maintain genetic levels for resistance to disease. Availability of direct evaluations for health traits now makes selection for disease resistance more effective and can help us do better.
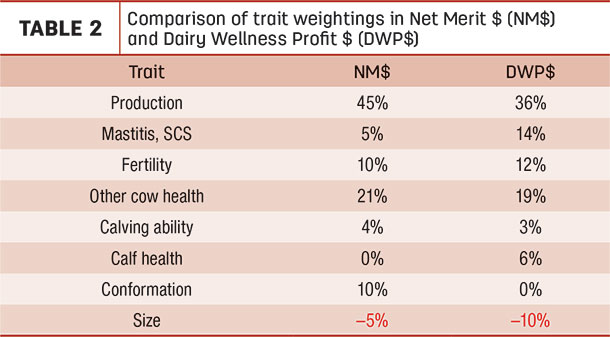
Most industry indexes like Net Merit Dollars (NM$) include health traits, but only with a small emphasis. Dairy Wellness Profit Dollars (DWP$) is an alternative that has a different approach. A quick comparison of the two indices shows the difference.
Comparison of trait weightings in NM$ and DWP$
One thing that stands out in this comparison is the difference in emphasis on mastitis resistance. Direct evaluations for mastitis have been available from Zoetis since 2016 and from the Council on Dairy Cattle Breeding (CDCB) since 2018.
These evaluations are independently validated and, when conducting herd audits, it is clear these evaluations effectively identify cows that have the genetic capability to resist clinical mastitis. In Table 3 are genetic audit results for second-lactation cows in a large herd with genomic evaluation results.
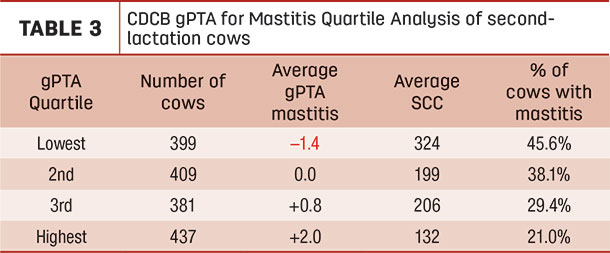
CDCB gPTA for mastitis quartile analysis of second-lactation cows
Mastitis is a management challenge for almost all dairies. The costs of clinical and sub-clinical cases of the disease are significant, and it is a major reason why cows leave the herd. Now that we have evaluations which directly assess genetic resistance to mastitis, it is highly recommended traits like CDCB Mastitis Resistance and Zoetis Mastitis be included in selection indexes.
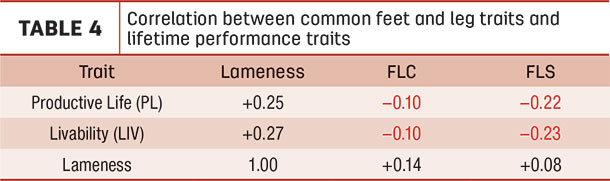
Lameness is another management challenge for most dairies and an important animal welfare concern. DWP$ is the only national index that includes lameness resistance. It is summarized in Table 3 as part of the Other Cow Health category. Traditionally, the industry has focused on feet and leg conformation traits as an indirect indicator of hoof health and mobility. When studying genetic evaluations of high-reliability bulls, we see the expected positive correlations between lameness resistance, Productive Life (PL) and Livability (LIV). Correlations of the conformation traits Feet and Legs Composite (FLC) and Feet and Legs Score (FLS) have negative correlations with PL and LIV, which is opposite of what we expect. The correlations between lameness resistance and the feet and leg conformation traits are slightly positive. Including lameness in your selection index will be much more effective at improving hoof health than using the traditional feet and leg conformation traits.
Correlation between common feet and leg traits and lifetime performance traits
DWP$ and NM$ are industry-wide indexes routinely available for your use. Industry indexes are very comprehensive to address the needs of a wide range of herds. They may not adequately address the uniqueness of your herd. They also may include more traits than what is needed for your dairy. Working with your genetic consultant to develop a customized index is a viable alternative to using national indexes. This can allow you the opportunity to focus on traits essential to your operation and to tailor the index to your specific milk pricing situation.
Whether you use a customized index or an industry-wide index, it is important to keep in mind the capabilities your cows will need to be profitable members of the herd in the future. As heifer inventories shrink and culling rates decline, future cows will need to have a higher level of disease resistance to allow them to last another lactation or two. Mastitis and lameness are among the most common health issues and should receive focus when choosing or designing a selection index.