


October’s growth can again be attributed to stronger milk output per cow and a continuation of higher cow numbers among a few major dairy states, according to the USDA’s monthly Milk Production report, released Nov. 19.
A related storyline is a revision in cow numbers: September’s preliminary estimate was raised by 5,000 head. Since June, U.S. cow numbers are now up 8,000 head; and cow numbers in the 24 major dairy states are up 29,000 head.
October 2018-19 recap at a glance
Reviewing the USDA preliminary estimates for October 2019 compared to October 2018:
- U.S. milk production: 18.11 billion pounds, up 1.3%
- U.S. cow numbers: 9.327 million, down 40,000 head
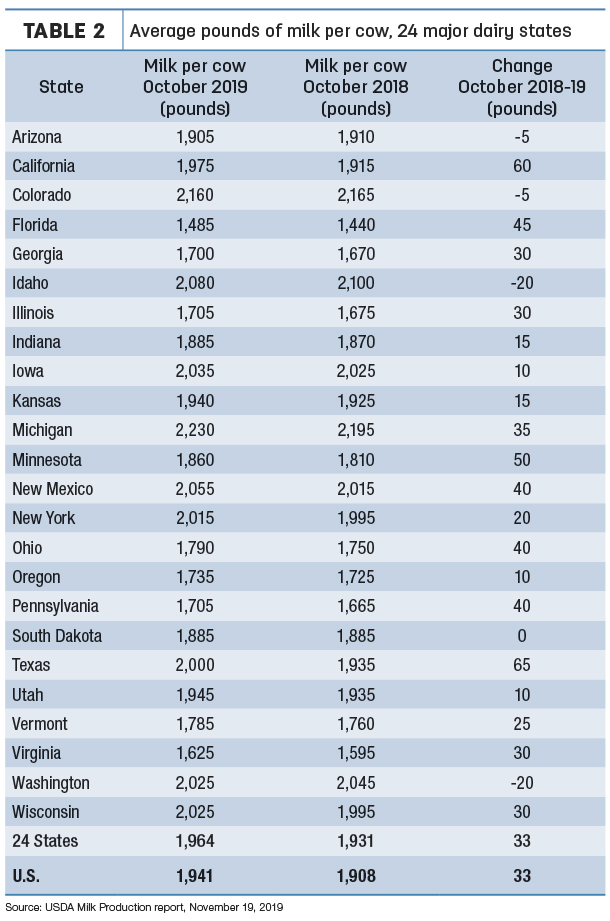
- U.S. average milk per cow per month: 1,941 pounds, up 33 pounds
- 24-state milk production: 17.30 billion pounds, up 1.7%
- 24-state cow numbers: 8.806 million, down 1,000 head
- 24-state average milk per cow per month: 1,964 pounds, up 33 pounds
Source: USDA Milk Production report, Nov. 19, 2019
Cow numbers building in major states
In March 2019, U.S. cow numbers were 100,000 head fewer than a year earlier, but the monthly year-over-year difference has been shrinking. Compared to a year earlier, October’s cow numbers were down 40,000 nationally but just 1,000 fewer in the 24 major dairy states (Table 1).
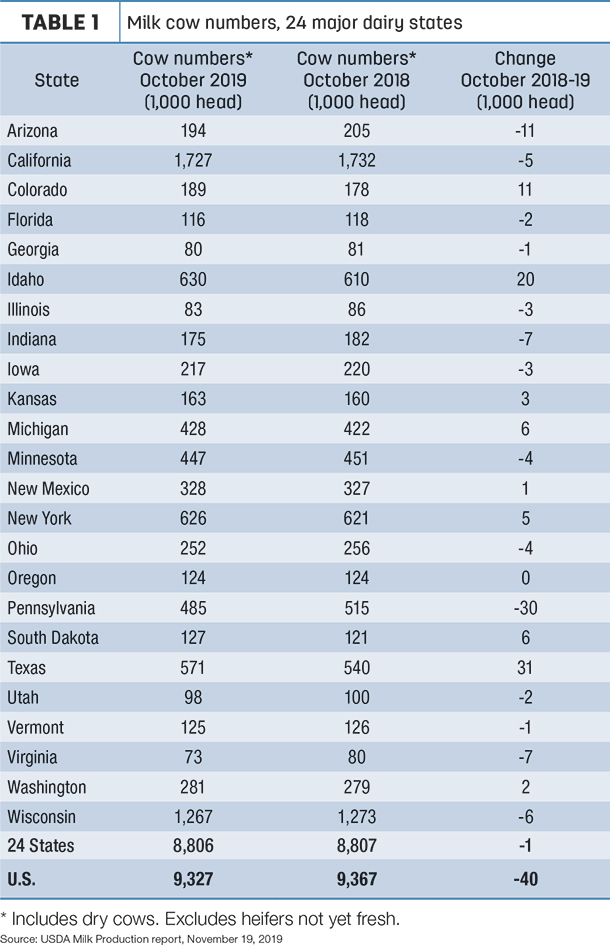
Strongest year-to-year growth in cow numbers is occurring in Texas, Idaho and Colorado, up 62,000 head combined. More moderate increases were in Michigan, South Dakota and New York. Compared to a month earlier, cow numbers increased by 1,000 head in Idaho, New Mexico, Ohio, Texas and Utah.
Pennsylvania continues to pace decliners, down 30,000 cows from a year ago, followed by Arizona, down 11,000 head. The USDA estimated dairy farms in 12 other states were milking fewer cows than a year earlier.
Milk per cow again strong
Nationwide and in the 24 major dairy states, October 2019’s increase in average milk output per cow compared to a year earlier was estimated at 33 pounds, again the strongest since January. Cows in 19 states yielded higher milk output per cow in October compared to the same month a year earlier (Table 2). Biggest gains were in Texas (+65 pounds) and California (+60 pounds per cow). Michigan continued to be the national leader in milk output per cow on a monthly basis.
Among all major states, Texas led in terms of milk volume and percentage growth in October 2019, up 97 million pounds (9.3%) from a year earlier. California output was up 94 million pounds (2.8%), and Idaho production was up 29 million pounds (2.3%). Wisconsin milk production was up 26 million pounds, a modest 1% growth.
Pennsylvania production was down 30 million pounds (-3.5%), while Arizona production was down 22 million pounds (-5.6%).
The USDA’s November World Ag Supply and Demand Estimates (WASDE) report raised milk production estimates for both 2019 and 2020 and provided a brighter outlook for 2019 prices. Looking ahead, the USDA forecasts U.S. average all-milk prices to top $20 per hundredweight (cwt) in the fourth quarter of 2019 and then averaging $18.85 per cwt through 2020. Read: USDA raises 2019 price outlook but forecasts more milk in both 2019 and 2020.
Cropp and Stephenson remain optimistic
Following the USDA’s monthly Milk Production report, Mark Stephenson, director of dairy policy analysis, and Bob Cropp, dairy economics professor emeritus at the University of Wisconsin – Madison, provided an overview of dairy markets in their monthly podcast.
Growth in production per cow continues to surprise Stephenson, especially in light of reports of average-to-poor forage quality and adequate-to-short forage quantity. With the onset of winter, Cropp cited similar feed and weather conditions in the Northeast.
“I think we’re going to have problems when we start getting into this silage,” Stephenson said.
On a roller coaster of late, cheese prices will push the November Class III milk price above $20 per cwt, Cropp said. (The November Federal Milk Marketing Order Class II, III and IV milk prices will be announced Dec. 4.) Nonfat dry milk is also a bright spot in the market, he said, and even whey prices have shown some improvement.
Offering a price outlook, Cropp said the 2019 average milk price will be about $2.20 per cwt higher than 2018. Despite October’s milk production estimates, Cropp doesn’t see large-scale dairy expansion or milk production growth, citing farm-level financial stress, lower feed quality and tighter supplies of replacement heifers. With the export picture looking promising, Cropp remains more optimistic than current futures prices or the USDA forecasts, even with futures prices having recently moved higher. Both he and Stephenson forecast 2020 milk prices will average $1 to $1.20 per cwt higher than 2019.
Diverging from a general discussion of dairy markets, Stephenson and Cropp used their podcast to discuss the potential ramifications of Dean Foods’ bankruptcy.
Read: Dean Foods files Chapter 11 bankruptcy, negotiating with DFA and Dairy farmers to receive Dean milk payments.
Cropp noted the company has been struggling with declining fluid milk sales and tight margins in a business made even more competitive by the entry of WalMart. Dean has assured farmers they will be paid for milk, and several states have marketing security bonding programs in place to protect individual farmers.
“I don’t think there’s a danger that farmers aren’t going to get paid,” Cropp said.
Stephenson estimated Dean represented at least one-third of U.S. fluid milk sales and 10% of total U.S. milk sales.
“Fluid sales have been difficult and hard, but a Dean Foods bankruptcy does not mean they’re going to be worse,” Stephenson said. “We’re still going to sell a lot of fluid milk, whether Deans is packaging it, or somebody else purchases the assets,” Stephenson said.
Worst-case scenario, he said, is that some farmers may lose local markets if any Dean plants are closed due to location or age, which could increase farmer hauling costs to other plants. ![]()

-
Dave Natzke
- Editor
- Progressive Dairy
- Email Dave Natzke

