

There is much concern about the reliability of hay test results and how lab results impact price and sales of hay.


However, some of the concern about the reliability of laboratory results is brought about, not by the performance of the labs themselves, but by unrealistic expectations, abuses or misunderstandings of the whole hay testing process.
Six common abuses of hay testing results are outlined below, and potential solutions to those abuses are outlined.
Misuse 1: Failure to expect some variation in hay tests
“My customer wanted 170 RFV hay, but my hay tested only at 165, so they refused it.” Overemphasizing small differences in lab results for the purposes of hay marketing is quite common. However, this is clearly an abuse of the hay testing process. With current technology of sampling and lab analysis, there is no reliable way to measure a five-point difference in RFV value between two hay lots.
Solution: Each reported lab value examined for the purposes of trade should have an “error” term associated with it. This is likely to be a minimum of 0.5% CP, 1% ADF and 1.5% NDF – and in practice more due to sampling variation.
Misuse 2: Biased sampling
“I brought a flake into the lab, but it didn’t match another sample from the same lot.” Sometimes people will submit samples to the lab that do not fairly represent the hay lot. Only use proper sampling techniques using a hay probe.
Solution: Follow proper protocols for sampling (see foragetesting.org for the protocols), including combining 20 cores, using good sharp coring devices and using accepted techniques.
Misuse 3: Encouraging lab bias
“It seems that Lab X always gives values that are two points above Lab Y,” says one client. “Since it suits my purposes, I’ll just insist upon using Lab X.”
While some amount of random variation (plus or minus) between labs is normal, a consistent difference of several points, always in one direction, is a significant problem. Some of this is the lab’s problem, but part of the problem is in the willingness of customers to exploit these differences to gain economic advantage. However, it is up to the customers of the labs to insist upon unbiased hay analysis methods by their laboratory.
Solution: Only work with those labs that are interested in standardizing their methods and perform well on NFTA or other programs and avoid biasing their results to please customers.
Misuse 4: Misinterpreting calculated values
“My buyer said the RFV was OK but the NDF was not good enough; as a result, the deal fell through.”
This discussion revealed a lack of understanding (or alternatively a deliberate misrepresentation) of how TDN or RFV or RFQ values are derived. These are calculations, not measurements. Let’s be clear: RFV is directly calculated from ADF and NDF. TDN is most frequently calculated directly from the ADF. Additionally, RFV is almost 100% driven by NDF measurements. So if you know the NDF or ADF values, you’ll also know the RFV and TDN values. RFQ includes other measurements such as NDFD and ash, but it is also a calculated value.
Solution: When confusion arises between tests or hay lots over TDN or RFV, always refer to the original analyzed values (ADF or NDF or NDFD at 100% DM). Understand where your calculations are coming from; ask the laboratory to explain.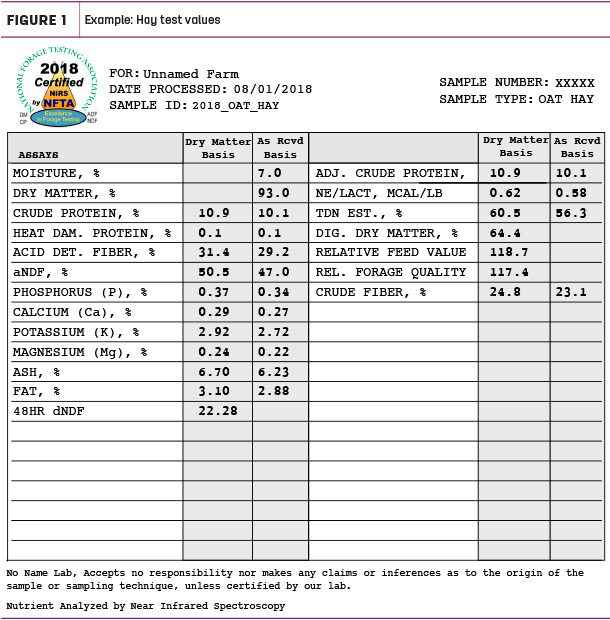
Misuse 5: Confusion over dry matter
“My hay is high in moisture but tested ‘Supreme’ in quality. My buyer said that because of the high moisture, the forage quality should be evaluated on an ‘as-received’ basis – and therefore should be lower in price.”
The expression of any lab value at a lower DM content causes the value to appear lower; for example, a 24% CP at 100% DM will be about a 20% CP at an 80% DM basis (e.g., “as received”). Confusion over dry matter and interpretation of lab reports has been a common problem with hay testing. However, all comparisons between hay lots should be made on 100% DM basis, not “as received” nor adjusted to 90% DM.
While high-moisture hay contributes a greater amount of water in the tonnage, it should have no effect on forage quality, which is independently measured. However, buyer (or seller) is completely justified in adjusting tonnage of the hay based upon the as-received dry matter content.
Solution: All parameters, ADF, CP, NDF, NDFD and TDN (as well as RFV) should only be compared on a 100% standardized moisture basis.
Note: The industry in California is accustomed to using TDN on a 90% DM basis – but this is actually calculated on a 100% DM basis and the 90% added back; so the calculation is based upon 100% DM.
Misuse 6: Failure to account for other quality factors
“This alfalfa hay was only 150 RFV (53 TDN), but it fed like a Premium-quality hay.” Alternatively: “I purchased this hay as a Premium hay, but it did not milk well.”
The standard hay test (ADF, NDF and CP) reveals certain things about a hay lot, but not all. Forage scientists and nutritionists for years have promoted the use of other measurements such as NDFD, nonstructural carbohydrates, lignin and ash to help predict the feeding value of a forage. The use of ADF or TDN calculated from ADF greatly simplifies the estimation of “feeding value,” sometimes to the point that it fails to predict the actual feeding value of the hay. There are many other factors that may contribute to true feeding value.
Digestibility is important, but also weeds, molds and condition (texture) can influence the feeding value. There are limitations to the way in which a standard hay test can predict milk production, and there are some aspects of hay quality that are not fully understood or are difficult to measure.
Solution: Use NDFD and ash analysis to help predict quality along with ADF, NDF and CP, and subjective visual analysis to determine feeding value. It is especially important to examine hay for the presence of weeds (especially toxic weeds), mold and physical characteristics that may affect the feeding value of the hay.
Summary
There is an inherent challenge to predict complex biological processes with a few chemical tests or estimates from light reflection. Information, communication and negotiation are the keys to agreeing on a fair price for the producer and consumer. Hay testing has proven to be an invaluable tool in predicting feeding value. However, hay analysis is meant to be an instrument, not a hammer to bludgeon prices.
We can avoid abusing hay test results by understanding the range of normal variation in hay test results, using proper sampling methods, choosing a lab from “NFTA- proficient” labs, interpret lab values expressed at a uniform DM content, and understanding the limitations of hay tests, only using them in addition to subjective visual evaluation of hay quality.
—This article is revised from proceedings 2019, Western Alfalfa and Forage Symposium.
References omitted but are available upon request by sending an email to the editor.


