Last summer, I had the opportunity to work as an intern for Standard Dairy Consultants in southern Idaho, working with nutrition consultant Tevan Brady. For the summer, I was assigned a project where along with Brady, I evaluated the shrink of two to three dry commodities on several client dairies for eight weeks. At the end of the project, we developed a process for evaluating shrink on the commodities.
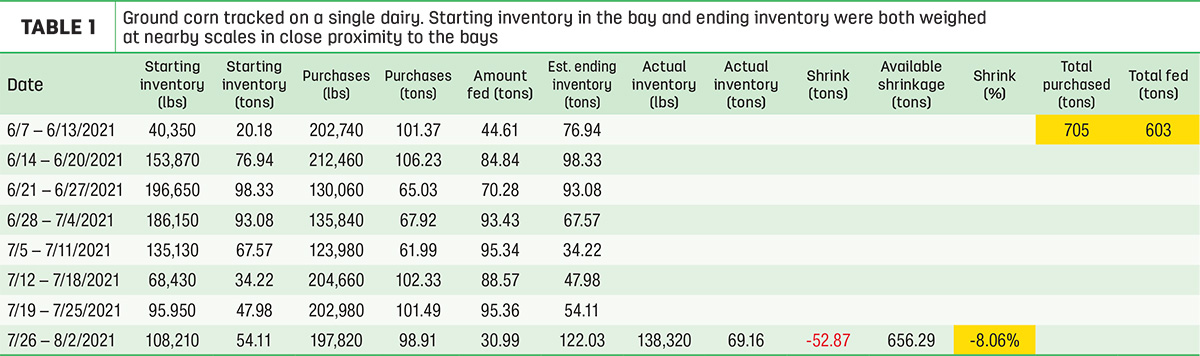
At the beginning of the project, we introduced ourselves and explained the project to the feed managers of each dairy operation. At that time, we made an initial assessment of the feed inventory (Table 1).
Following the initial meeting, we made a weekly visit to each dairy to do the following:
- Assess the current inventory
- Gather feeding data from on-farm feeding software
- Obtain purchase information from the purchaser or chief financial officer of the dairy
Issues impacting shrink
Throughout the summer, as we evaluated the commodities, I found that many factors can contribute to the shrink commodities experience during storage. These include:
- Physical properties – lighter and fine particles are more prone to shrink.
- Delivery and facilities – the type of equipment used to deliver the commodity, the level of protection from the environment (wind, rain, etc.) and smoothness of the feed area.
- Environment – some areas are more prone to wind and precipitation.
- Time exposed to shrink – the sooner a product is fed, the less exposure to shrink.
- Feeding techniques and feeder expertise – the size of batches relative to mixer size, feeders’ ability to manipulate the equipment and commodity.
We found that the sources of shrink in southern Idaho are primarily of two types:
- Environmental – the wind is a major environmental factor impacting feed storage in southern Idaho. This has led many operations to build enclosed feed centers.
- Operational – this includes storage, delivery and handling, mixing techniques and feeder skills.
As an example: Commodity price = $410 per ton with 5% shrink = true cost of $431.50 per ton
Challenges we experienced
One of the biggest challenges we experienced during this process was estimating starting and ending inventories. Very seldom is the inventory of an ingredient on a dairy at zero. A visual estimate is possible, but it can be challenging to have reasonable accuracy.
Here are a few ways we found to gain more accuracy:
- Estimating volume: We built a box with one cubic foot of volume, (12-inches long on all sides). Then we filled the box and weighed the contents: this is the density or pounds per cubic foot (lbs/cu ft). Then we estimated the length, width and height of the ingredient piled in the bay. This gave us the cubic feet of ingredients. We multiplied that by the density and divided it by 2,000. This gave us a reasonable estimate of tons of inventory (cu ft X density) / 2,000).
- Starting with empty bays: If two bays were available, we’d have one bay completely emptied and then filled back up. We’d use the amount delivered into that bay as the starting inventory. If using this method, it is important to communicate to the feeders that the bay just filled is not to be used before the other bay is empty. It is also important to record which load being mixed is the first one using said ingredient from the bay in which the starting inventory is recorded.
- Knowing about substitutions: This occurred when a dairy ran out of an ingredient for a short time, and it wasn’t available for a few loads of the diet to be mixed. Typically, the change wasn’t recorded in the on-farm software. This resulted in an ingredient being recorded as fed when there was no inventory available and could result in positive shrink – more product fed than was available. Knowing about these substitutions helped us minimize errors as much as possible.
- Using delivery scales: Delivery scales are maintained and certified regularly on most large dairies. Mixer scales may or may not receive the same level of attention. This can be a source of error in the usage calculation, over- or underestimating the amount fed.
Protocol to track commodity shrink:
1. Determine which commodities you want to track and a starting and ending date for the tracking. We found tracking on a weekly basis contributed to accuracy and ease of estimating the inventories.
2. Determine a starting inventory:
- Start with an empty bay. When a load is delivered you will know exactly how much is in that bay.
Or
- Estimate the volume of a commodity in a bay by determining the density of a cubic foot of that commodity. Multiply the volume by the cubic feet and divide by 2,000 to get a fairly accurate starting point. For example: the pile of a commodity is 20 feet wide, by 18 feet tall by 30 feet deep (20 X 18 X 30 = 10,800 cu ft). One cubic foot of ground corn weighs 45 pounds per cubic foot. (10,800 cu ft X 45 lbs = 486,000 lbs). Divide by 2,000 to determine the tons available: 486,000 pounds divided by 2,000 equals 243 tons of ground corn in that bay.
3. Determine the quantity purchased during the prior week. Those numbers can be attained from feed software or from the person on the dairy responsible for purchasing.
4. Download a usage report from the feeding software for the prior week being evaluated. The time frame evaluated needs to align with the time period in which purchases are made. Once you have the starting inventory, purchases and usage reports, you can find an estimated ending inventory for that week by adding the starting inventory to the purchase inventory and subtracting the amount fed (all in tons) to get an estimated ending inventory for that week.
For example: Starting (15 tons) plus purchases (66 tons) minus the amount fed (16 tons) equals an estimated ending inventory (65 tons). This provides an estimated ending inventory every week.
5. When you want to stop tracking inventory, you will need to find an actual ending inventory. Follow the same process as in step 2 to determine this amount.
6. The difference between the actual ending inventory and the estimated ending inventory is the shrink in tons.
7. Determine the total tons exposed to shrink: Starting inventory (in tons) plus total purchases (in tons) minus the actual ending inventory equals tons exposed to shrink.
8. Divide shrink in tons by the total tons available to determine the percentage of shrink.
9. Total shrink equals the tons of a commodity exposed to shrink divided by the percentage of shrink.
Here are some of the takeaways from my internship relative to estimating shrink:
- Starting and ending inventories are difficult to measure accurately without having some process to calculate them.
- Time exposed for shrink to occur can have an impact. One dairy stored whole corn and had a closed system to grind and deliver it to a bay. This happened a couple times a week. This resulted in a smaller amount of ingredients being exposed to the environment for a shorter amount of time.
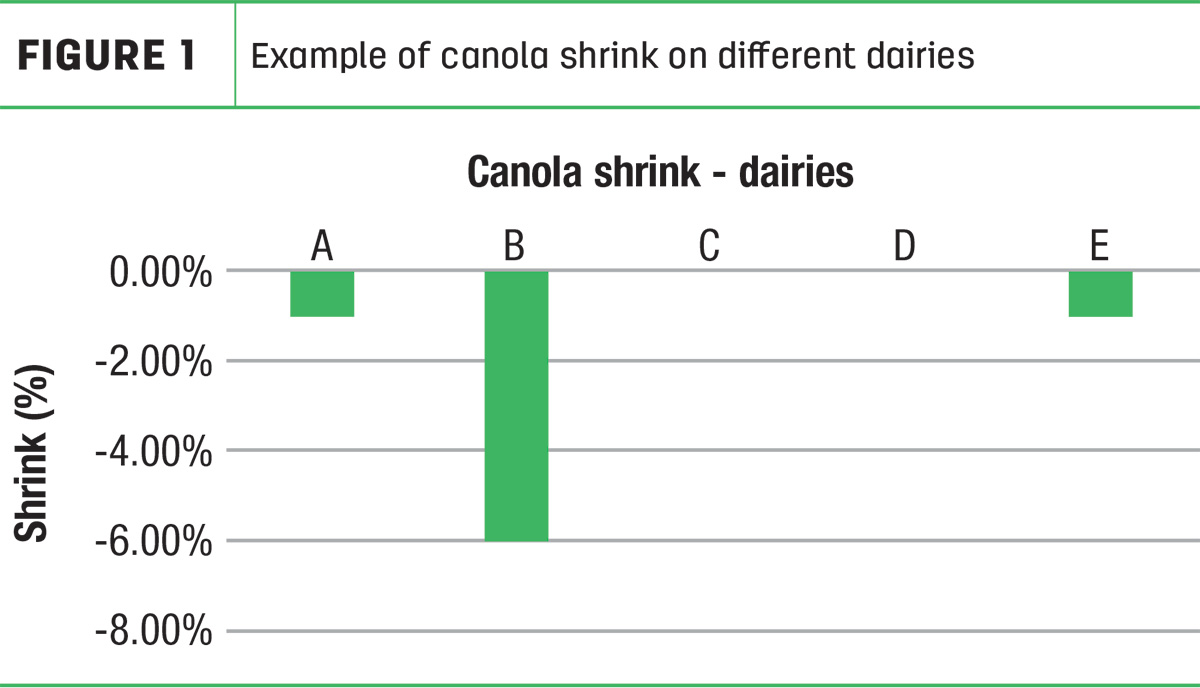
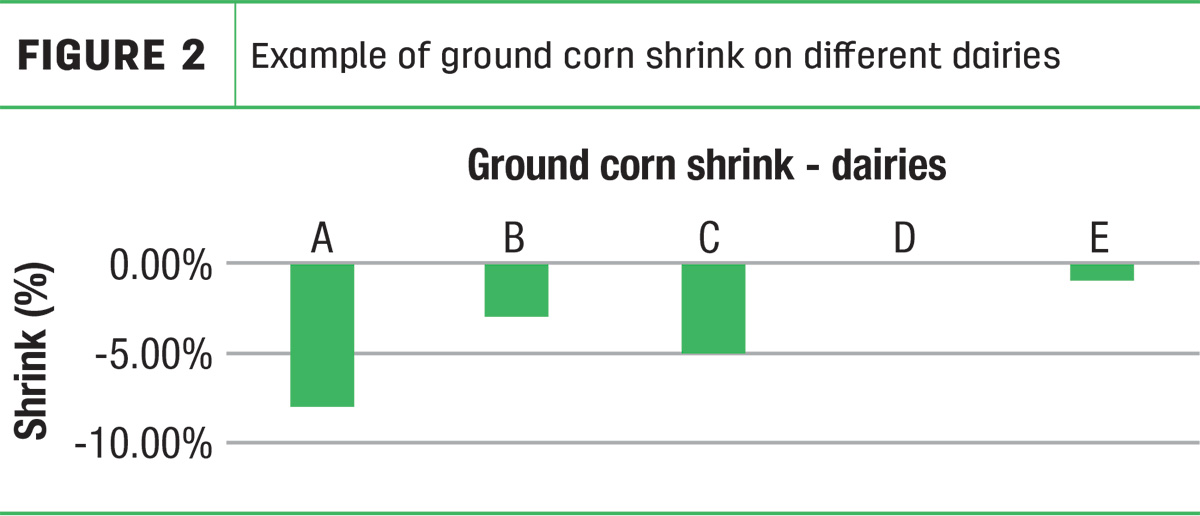
- Shrink can vary from dairy to dairy based on the feeding program, the ingredients’ physical properties and how they are handled.
The author and contributors provide dairy nutrition and management consulting as part of Standard Dairy Consultants (SDC). SDC provides innovative and customized solutions to dairy producers throughout the U.S., with facilities in Idaho, Iowa, Pennsylvania, Texas and Washington.