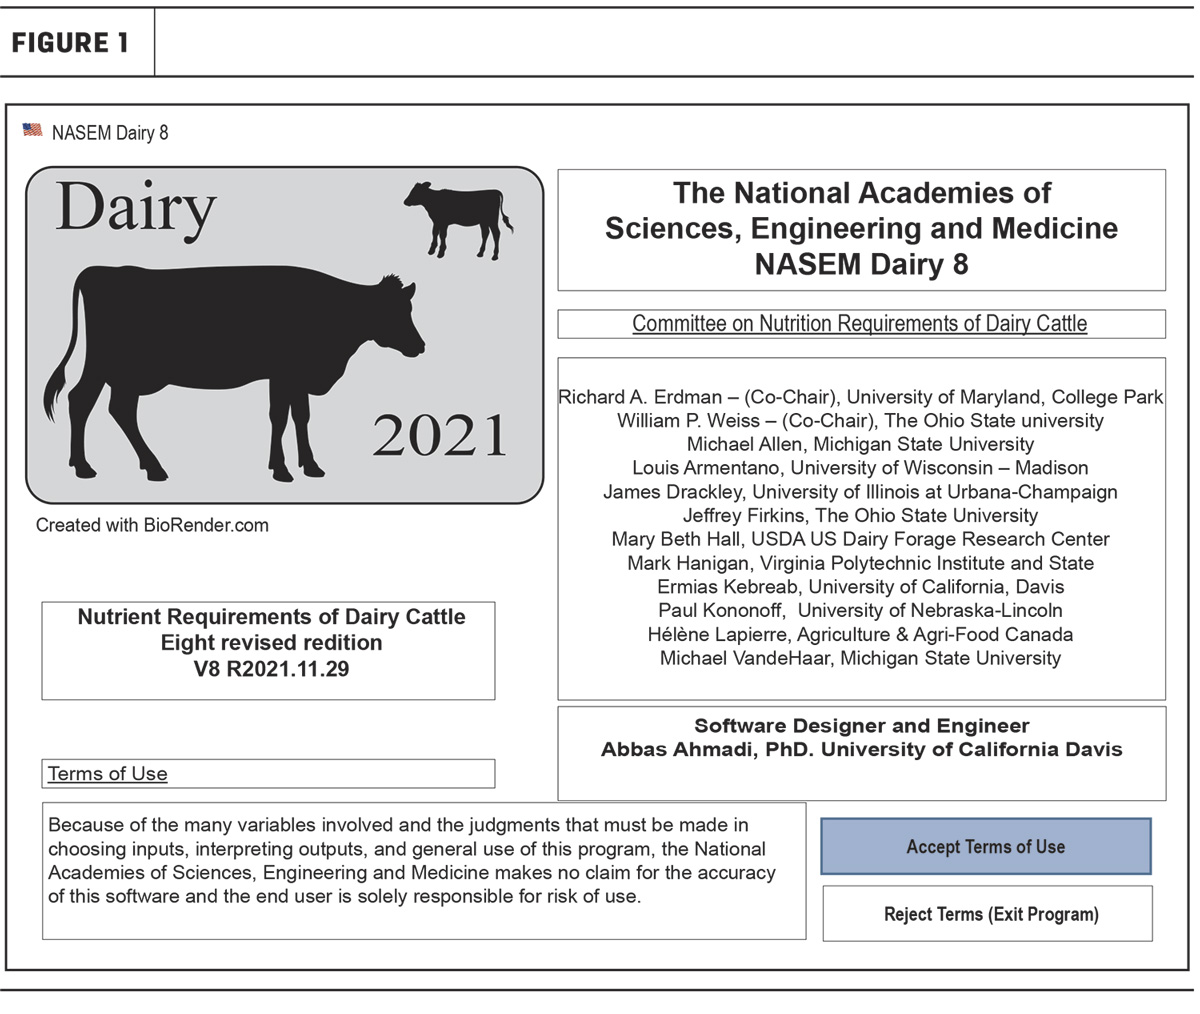
The most recent report on dairy cattle nutrient requirements was published by the National Academies of Science, Engineering and Medicine (NASEM) in December 2021. The report, and therefore the software, represents an update of the 2001 findings with major revisions for intake predictions, macro-nutrient digestion, macro-nutrient requirements for calves and heifers and amino acid requirements for cows. The software format follows the same general format as most ration balancers, so we will focus on several key changes to the 2021 model and thus the interface (Figure 1).


Feedstuff inputs
The feed library contains over 220 ingredients, and user-defined ingredients can be added. Ingredients selected for use in a diet are copied to the simulation file, and any edits to ingredients are saved in the simulation file so the edited ingredient can be added to the feed library for use in other diets.
An important refinement in the energy system is allowing the user to specify 48-hour in vitro fiber digestibilities for feedstuffs (Figure 2).
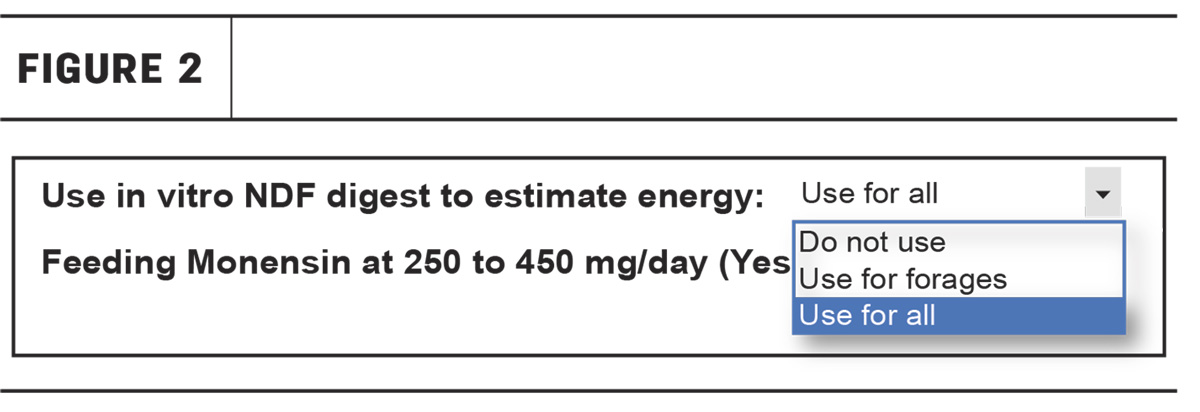 Fiber digestion is an important variable where neutral detergent fiber
(NDF) typically represents a minimum of 30% of diet dry matter (DM). NDF
digestibility is affected by plant maturity, type and growing
conditions. Some of this variation can be captured through 48-hour in
vitro NDF digestibility assessments. These values should be entered in
the “NDF Digestibility” field, and the user selects a use category from
the “Use in vitro NDF digest to estimate energy” drop-down to better
reflect energy values of specific NDF sources.
Fiber digestion is an important variable where neutral detergent fiber
(NDF) typically represents a minimum of 30% of diet dry matter (DM). NDF
digestibility is affected by plant maturity, type and growing
conditions. Some of this variation can be captured through 48-hour in
vitro NDF digestibility assessments. These values should be entered in
the “NDF Digestibility” field, and the user selects a use category from
the “Use in vitro NDF digest to estimate energy” drop-down to better
reflect energy values of specific NDF sources.
Ration development
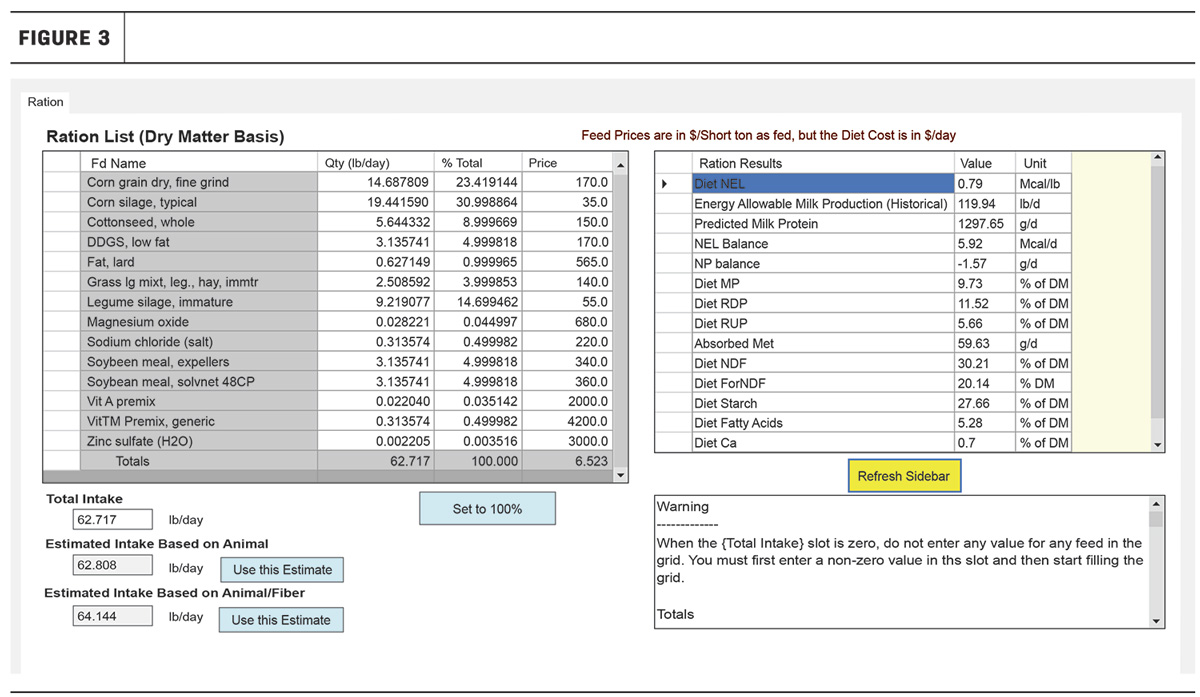
Figure 3 shows an example of the ration development interface. One primary difference from the 2001 program is the addition of a column to add feed prices per short ton to monitor daily animal diet cost. Another difference is the inclusion of more than a single estimate of DM intake for lactating cows and heifers; one based solely on animal inputs and another based on animal inputs and dietary fiber content.
Report modifications
The following report discussion is based on a lactating animal as those reports contain the widest range of values. Choosing other animal types will “shut off” one or more table sections or values within the tables. Only a few of the referenced report tables are printed here, so readers are encouraged to review the free software.
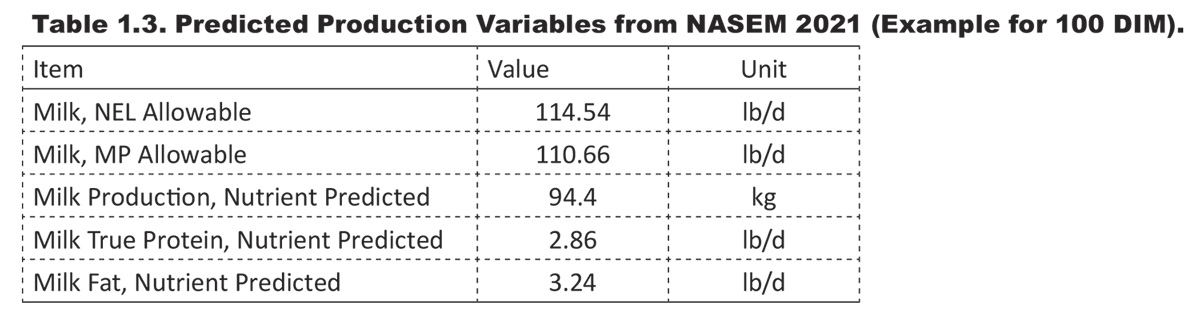
Animal input specifications are provided in Tables 1.1 and 1.2, with the latter also listing predicted dry matter intake (DMI). Table 1.3 contains additional inputs and historical predictions of allowable milk production based on net energy used for lactation (NEL) and metabolizable protein (MP), and the new nutrient allowable estimates of milk, milk protein and milkfat production. The latter are based on an integration of energy, essential amino acids and dietary fatty acid supplies. The NEL- and MP-based predictions are calculated as in the 2001 model and thus suffer the same conceptual and severe slope bias problems (see Table 20-16 in the NASEM 2021 report). Thus, they should not be used for diet formulation.
Energy supply partitioning is provided in Table 4.1, requirement partitioning in Table 4.2 and ingredient contributions to energy supply in Table 4.3. These tables provide a clearer picture of partitioning and losses than the 2001 model. A notable change is the splitting of gain into frame and reserves, where frame represents gain in a growing animal, and reserves gain represents primarily bodyfat gain in excess of that associated with normal growth. Reserves gain is the only gain in mature animals but can also be a component of gain in a growing animal if it is gaining body condition. This provides more accurate estimates of body composition changes.
Estimates of the dietary supplies of several individual fatty acids are provided in Table 5. However, data were insufficient to carry the supply equations through individual digested fatty acids and to net use for production.
Tables in section 6 summarize protein and amino acid supply and use. This information represents a major update to the lactating cow model, but data were not adequate to carry the same level of complexity for calves, heifers and dry cows. Table 6.1 lists contributors to metabolizable protein supply. Noteworthy changes are that microbial protein is predicted as an integrated function of the supplies of ruminally degraded starch, fiber and protein, and metabolizable protein supply no longer contains the endogenous protein flow from the rumen. Table 6.2 lists the net protein requirements and associated metabolizable protein estimates for each. Lactation requirements are calculated both for target (user-entered) and nutrient-allowable (predicted from energy and essential amino acid supplies) levels of production.
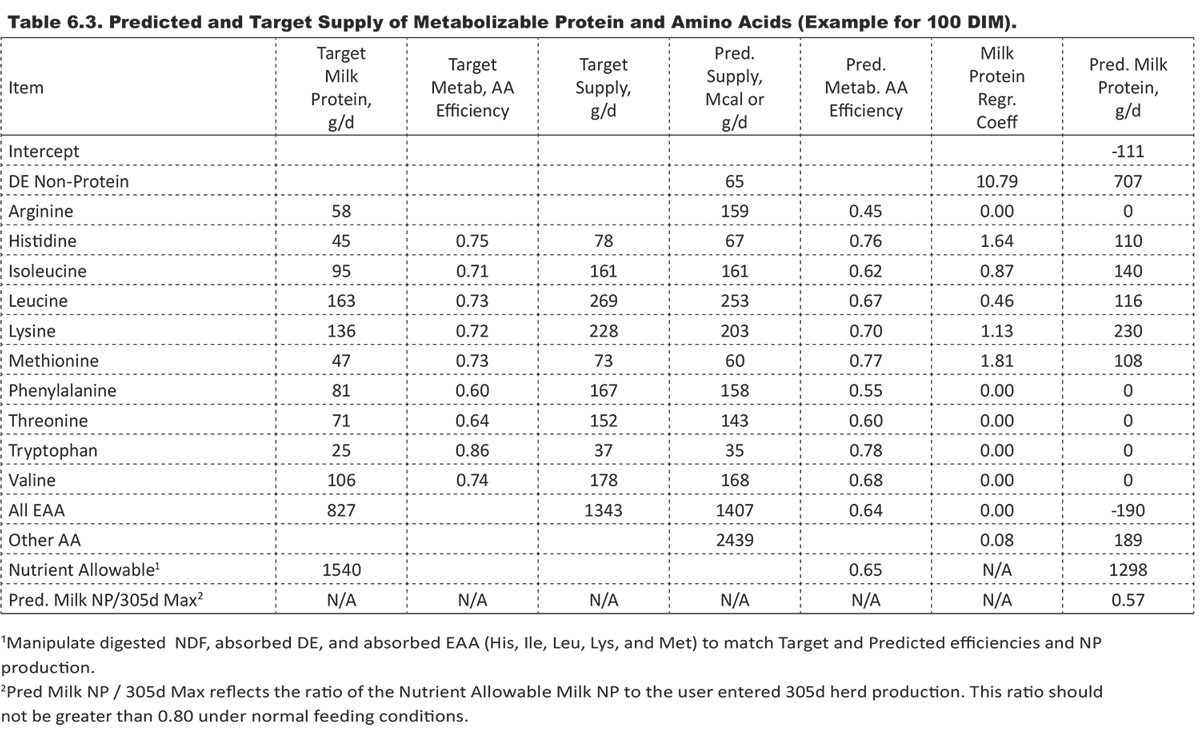
Table 6.3 summarizes the net milk amino acid requirements and predicted supplies for each essential amino acid. The first three columns specify the target levels of net milk protein amino acid output, the target metabolizable amino acid efficiency and as a product of the first two, the required supply of absorbed amino acids. These lead to columns four and five, which list the predicted supplies of amino acid and the predicted efficiency of use of each amino acid based on the nutrient-allowable protein prediction in column seven. The partial contribution of digested energy, each of the essential amino acids, digested NDF and use for maintenance are provided in column six. The simplest comparison is that of the target efficiencies versus the nutrient-allowable efficiencies, but the predicted and target-absorbed supplies can also be compared. Nutrient-allowable efficiencies greater than target efficiencies indicate a relative insufficiency and the reverse. However, it is critical to recognize that, within normal ranges, responses to each amino acid are independent and additive. Thus, one can expect a response to supplementation of each amino acid regardless of its relative sufficiency within normal ranges. This represents a major conceptual change from the past. Of course, one cannot base the entire diet on a single essential amino acid and expect production. The full complement of nutrients is required, but there is latitude for trade-offs or substitutions provided we don’t stray too far from the target ratios.
Report section eight provides a summary of the important environmental impacts of production. These are of growing interest to the consumer, and they should be assessed per pound or kilogram of milk. The U.S. dairy industry compares very favorably to other regions of the world because we have high levels of production, which dilutes maintenance impacts. Even though our impact per cow day is high, the relatively large footprint per cow is diluted by a large volume of milk, resulting in an impact per pound of milk near the top of the world.
The 2021 NASEM report, and thus the software, reflects the best information currently available, but there is much that is unknown or only partially understood. The NASEM software contains the mathematical representation of the system and is provided for educational and demonstration purposes rather than as a commercial product. Click here for instructions to download the free 2021 Dairy NASEM software.