


Update highlights

- Coming up: January 2023 DMC
- March 2023 Class I base price dips below $19
- January cull dairy cow marketing jumps
- December, 2022 fluid sales lower
- All-milk, mailbox price spread closes slightly in November
- Vitaliano: Cheese key to domestic, export growth
- Cottonseed: Mixed outlook for availability
Coming up: January 2023 DMC
The January 2023 Dairy Margin Coverage (DMC) program margin and potential indemnity payments are scheduled to be released Feb. 28. Check the Progressive Dairy website for an update.
March 2023 Class I base price dips below $19
March 2023’s Federal Milk Marketing Order (FMMO) advanced Class I base price moved lower, falling below $19 per hundredweight (cwt) for the first time since November 2021. The “average-of plus 74 cents” formula provided a small producer benefit over the previous “higher-of” formula.
At $18.99 per cwt, the March 2023 Class I base is down $1.79 from February and $3.89 less than March 2022.
Class I zone differentials are added to the base price at principal pricing points to determine the actual Class I price in each FMMO. With those additions, March Class I prices will average approximately $21.81 per cwt across all FMMOs, ranging from a high of $24.39 per cwt in the Florida FMMO 6 to a low of $20.79 per cwt in the Upper Midwest FMMO 30.
Analyzing the Class I mover, the spread in the monthly advanced Class III skim milk pricing factor ($8.49 per cwt) and advanced Class IV skim milk pricing factor ($9.60 per cwt) is $1.11 per cwt, up slightly from February but still the second narrowest since June 2022.
Based on Progressive Dairy calculations, the Class I mover calculated under the higher-of formula would have resulted in a Class I base price of $18.80 per cwt, 19 cents less than the actual price determined using the average-of plus 74 cents formula.
The economic impact on uniform milk prices within individual FMMOs depends on Class I milk utilization in each FMMO. Those FMMOs with highest Class I utilization are affected the most.
Through the first quarter of 2023, the Class I base price averages $20.73 per cwt, 68 cents less than the same period a year ago.
January cull dairy cow marketing jumps
Marketing of U.S. dairy cull cows through U.S. slaughter plants rose in January, although some of the increase may be attributed to the calendar. And although final USDA January price estimates won’t be released until Feb. 28, strong cow beef prices and high feed costs are also likely contributing to the higher culling rates.
At 297,900 head, the January 2023 total was up 31,600 from December and 37,100 more than January 2022. January 2023 had one more weekday than the year before, potentially impacting slaughter plant operations. Nonetheless, the January 2023 total is the highest for any month since March 2021, when the U.S. dairy herd had 75,000 more cows.
Heaviest dairy culling during January occurred in the Southwest (Arizona, California, Hawaii and Nevada), where 77,000 dairy cows were marketed for beef. That was followed by the Upper Midwest (Illinois, Indiana, Michigan, Minnesota, Ohio and Wisconsin) at 67,100 head.
Other monthly regional totals were estimated at 45,300 head in Delaware, Maryland, Pennsylvania, West Virginia and Virginia; 39,700 head in Arkansas, Louisiana, New Mexico, Oklahoma and Texas; and 37,000 head in Alaska, Idaho, Oregon and Washington.
Primary data for the USDA’s Livestock Slaughter report are obtained from reports completed by inspectors from the USDA Food Safety and Inspection Service (FSIS). These counts are combined with data from state-administered non-federally inspected (NFI) slaughter plants to derive total commercial slaughter estimates. The USDA estimates there are approximately 900 livestock slaughter plants in the U.S. operating under federal inspection and nearly 1,900 state-inspected or custom-exempt slaughter plants.
December, 2022 fluid sales lower
Fluid milk sales ended the year as they began – down from the year before. Here’s an update on U.S. fluid milk sales data from the USDA Agricultural Marketing Service for December and the full year of 2022.
- Total sales: Sales of packaged fluid milk products totaled about 3.77 billion pounds, down 3.7% from the same month a year earlier. At 32.3 billion pounds, full-year 2022 sales of all fluid products were down 2.4%.
- Conventional products: Monthly sales totaled 3.54 billion pounds, down 3.3% from the same month a year earlier. Annual sales totaled 40.4 billion pounds, down 2.4% from 2021.
- Organic products: December sales totaled 230 million pounds, down 9.4% from a year earlier. At 2.85 billion pounds, 2022 sales of all fluid organic products were down 2%. Organic represented about 6.1% total fluid product sales in December and 6.6% for the year.
The U.S. figures are based on consumption of fluid milk products in FMMO areas, which account for approximately 92% of total U.S. fluid milk sales, and adding the other 8% from outside FMMO-regulated areas. Sales outlets include food stores, convenience stores, warehouse stores/wholesale clubs, non-food stores, schools, the food service industry and home delivery.
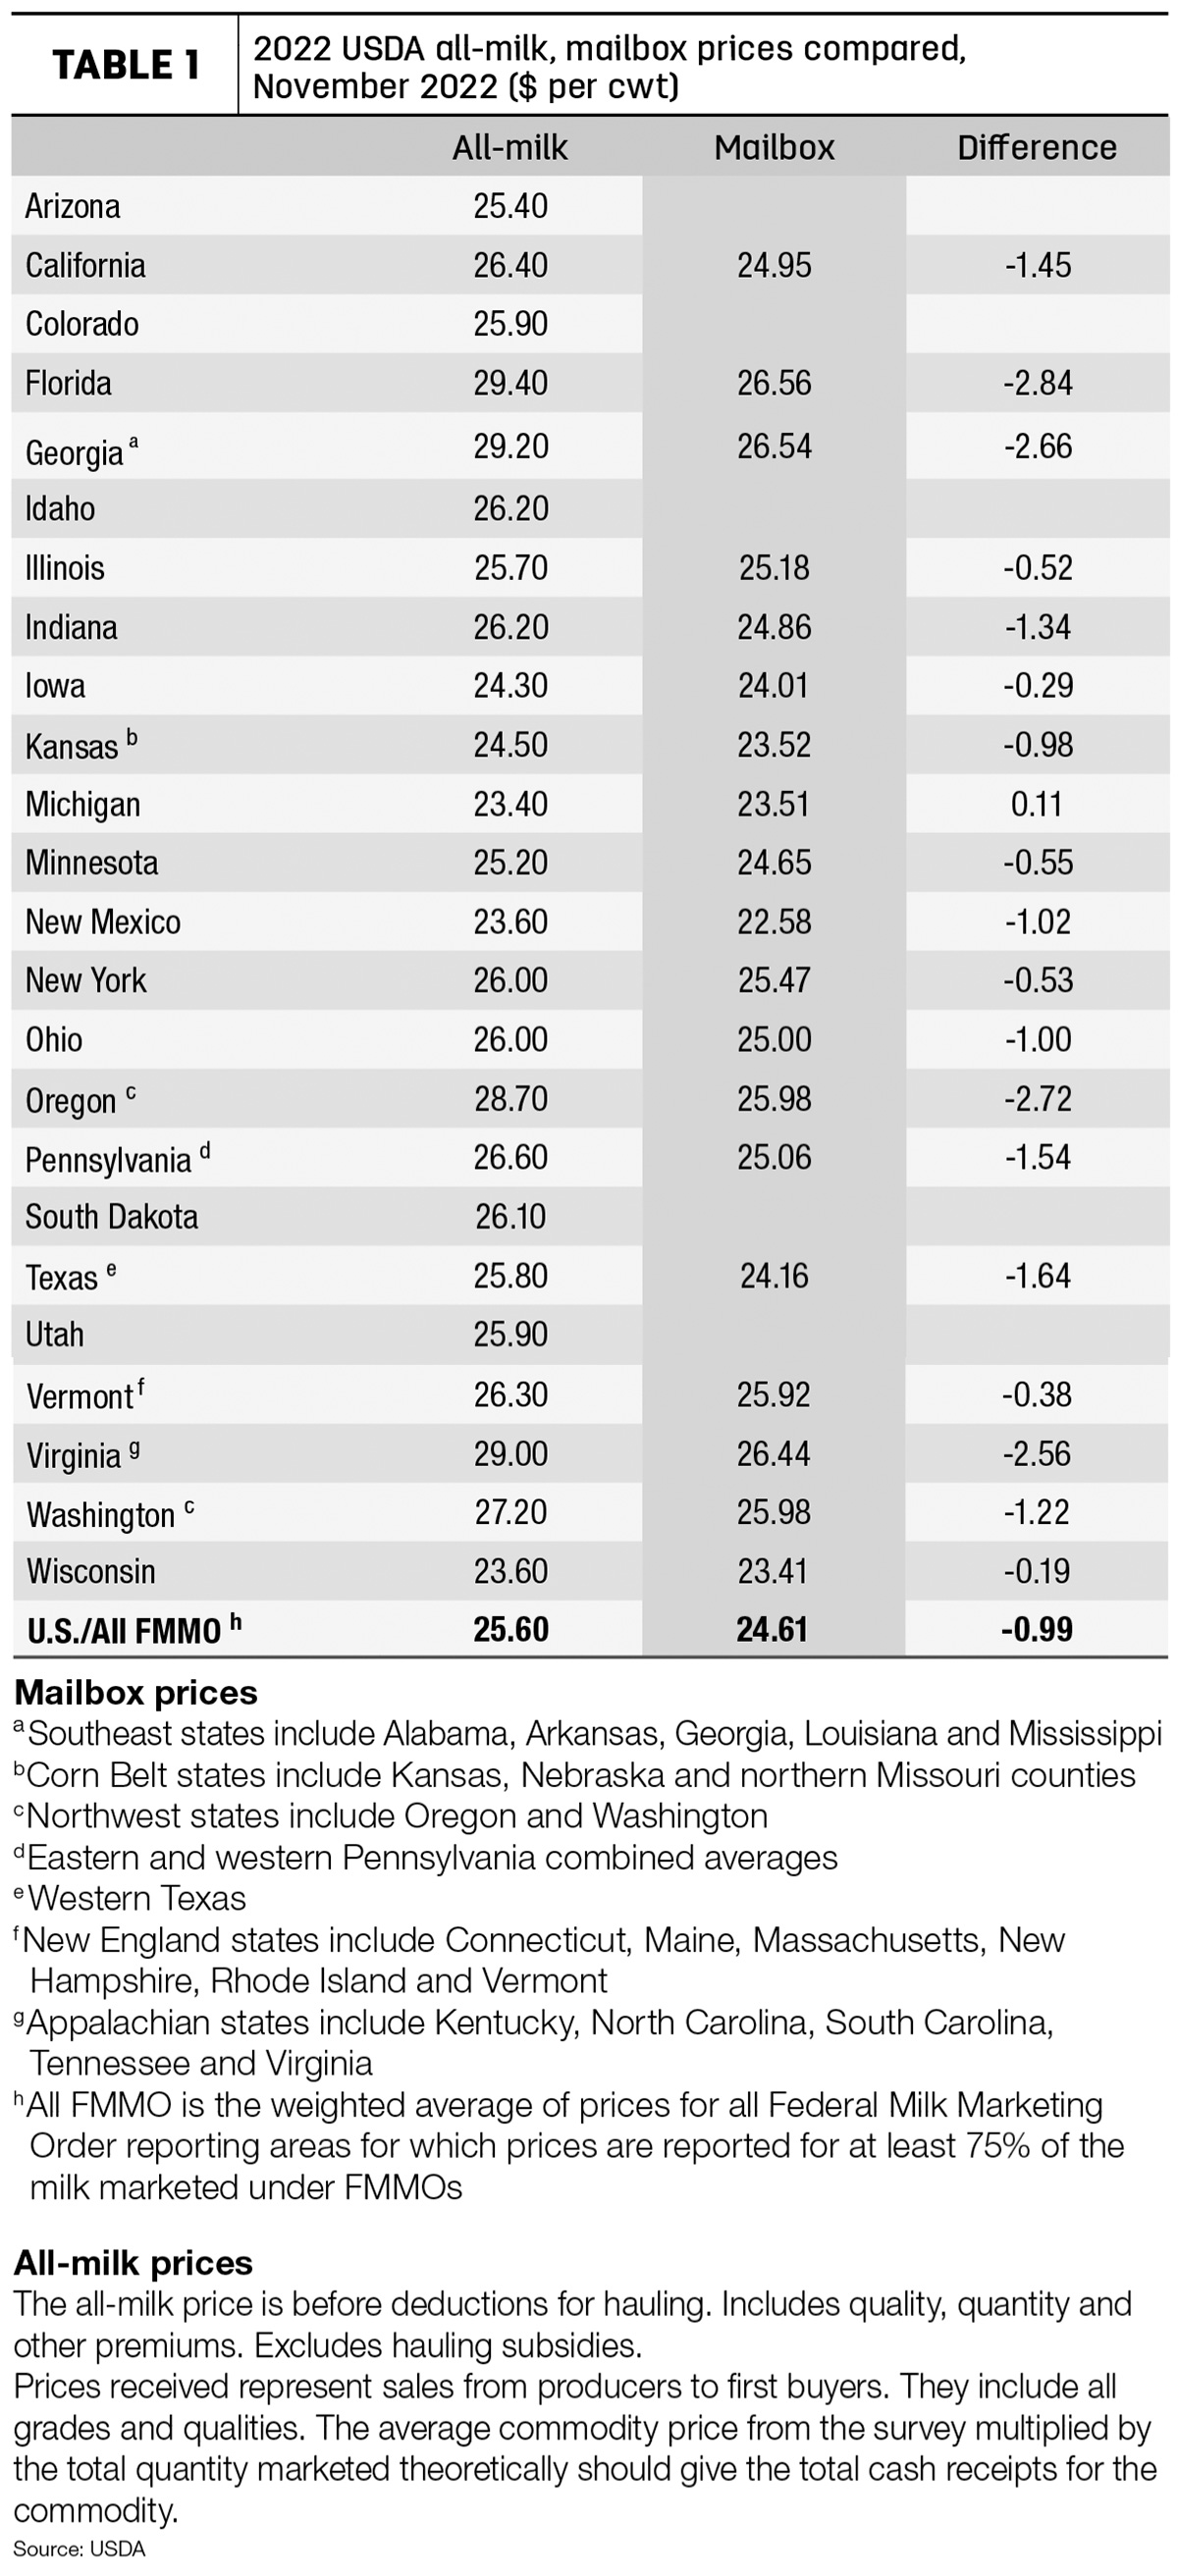
All-milk, mailbox price spread closes slightly in November
The gap between November 2022 average “mailbox” prices and the comparable “all-milk” prices narrowed to about 99 cents per cwt. Based on a preliminary look at two USDA milk price announcements:
- During November, U.S. all-milk prices averaged $25.60 per cwt, down 30 cents from October 2022.
- The November 2022 mailbox prices for selected FMMOs averaged $24.61 per cwt, down 25 cents per cwt from the month before.
The November spread between individual states or regions again varied widely, with a difference of about -$2.84 per cwt in Florida to -19 cents per cwt in Wisconsin (Table 1).
All-milk prices are reported monthly by the USDA National Ag Statistics Service (NASS). The all-milk price is the estimated gross milk price received by dairy producers for all grades and qualities of milk sold to first buyers, before marketing costs and other deductions. The price includes quality, quantity and other premiums, but hauling subsidies are excluded.
The mailbox price is the estimated net price received by producers for milk, including all payments received for milk sold and deducting costs associated with marketing. Mailbox prices are reported monthly by the USDA’s Agricultural Marketing Service (AMS) and generally lag all-milk price announcements by a month or more.
The price announcements reflect similar – but not exactly the same – geographic areas.
The difference in the two announced prices can affect dairy risk management, since indemnity payments under the Dairy Margin Coverage (DMC) are based on the all-milk price, while Dairy Revenue Protection (Dairy-RP) and Livestock Gross Margin for Dairy (LGM-Dairy) programs are based on FMMO class and component prices.
Vitaliano: Cheese key to domestic, export growth
Exports representing 17.8% of U.S. milk solids production in 2022 helped temper sluggish domestic consumption, according to National Milk Producers Federation’s Peter Vitaliano. Summarizing dairy markets in the February 2023 Dairy Management Inc./National Milk Producers Federation Dairy Market Report, he said that while overall domestic use of all dairy products was below year-ago levels on a milk equivalent basis, the final quarter of 2022 saw the strongest quarterly annual growth of domestic American-type cheese consumption since the first half of 2021.
Looking ahead, cheese is a key to further expansion of U.S. dairy exports. During calendar year 2022, 78% of the milk solids exported was in the form of dry skim milk ingredient products, while 11% was in the form of cheese.
For more information on commercial use, dairy trade, milk production, product inventories, prices and margins, click here.
Cottonseed: Mixed outlook for availability
Depending on location, dairy and beef cattle producers will see a mix in whole cottonseed availability this year, according to Cotton Incorporated.
“In the Southeast and Delta regions, producers will see increased availability of whole cottonseed to incorporate into their cattle rations,” said Larry Johnson, gin consultant and owner of Tactical Risk Advisors. “However, producers in the Southwest and West may need to contract the feed ingredient from other regions due to weather challenges impacting cotton harvests.”
High cotton prices motivated growers to increase acreage in 2022. However, adverse weather conditions allowed the fewest harvested acres since 2013. Based on USDA World Ag Supply and Demand Estimates (WASDE), 2022 cotton production was down 16% from the year before.
Cotton Incorporated recently updated a list of suppliers on the Cottonseed Marketplace, an interactive map used to connect buyers and sellers of whole cottonseed.


