


You have probably heard the saying “If you don’t measure it, you can’t manage it” or some variation of it. But is this really true? Dairy managers, and people in all industries, routinely manage things that are not measured. The reality is: People often have to make decisions with less-than-perfect information. I would contend many people have gotten quite good at managing things they don’t measure. But just because this is what we often do, does that mean making “gut feel” decisions without hard data is optimal? That is, could we manage some aspects of our businesses better yet if we had useful measurement data?

This article represents a case study of an individual dairy weighing cows at the time of calving. Specifically, this customized retrospective analysis attempts to determine if the information being measured and recorded has value for making management decisions.
Variation in cow weight
Figure 1 is a histogram showing the distribution of the weights at calving for first-lactation cows over a two-year period (2021-22) for the herd being analyzed. There were just under 3,000 cows in this sample with an average weight of 1,287 pounds with a standard deviation of 124 pounds. As a statistics refresher, with a normal distribution (i.e., bell-shaped curve) there would be approximately two-thirds of the observations in the range of the mean plus and minus one standard deviation. Applying those numbers to this herd suggests that roughly two-thirds of the cows weigh between 1,163 and 1,411 pounds (248-pound range). More importantly, it suggests that one-third of the cows are outside of that range, or more specifically, one-sixth of the cows weigh less than 1,163 pounds and one-sixth weigh more than 1,411 pounds. Likely some of this variation is due to measurement error, but even considering this possibility, this figure demonstrates considerable variation exists in first-calving cow weights for this herd.
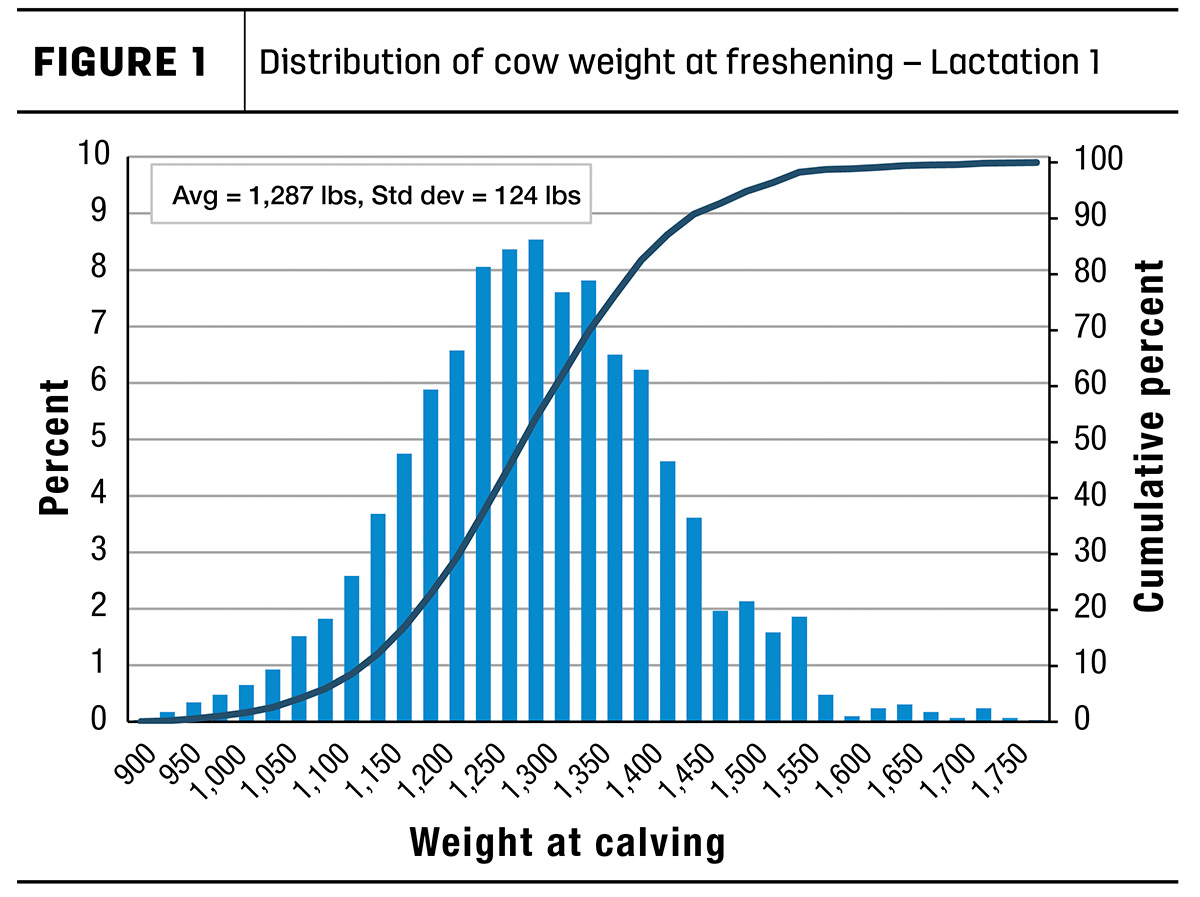
When looking at this figure, a question that comes to mind is: What drives this tremendous amount of variation in cow weights? How much a cow will weigh at the time she starts her first lactation will depend on many factors and measuring and/or accounting for all of these is not possible.
The dairy used for this analysis records calf weights at birth, at approximately 3 months and again at 6 months. When models of fresh cow weight were estimated considering these factors, they were statistically significant and had the expected direction (i.e., higher birthweight or average daily gain as a calf was associated with heavier cows at calving), but they explained very little of the variation that exists. Another variable positively related to weight at calving was the age at freshening, but like the other factors, the relationship was not particularly strong.
An important point of Figure 1 is if we weigh cows, we can quantify how much variation there is even if we cannot explain all the drivers of it. Put another way, “If we measure it, we at least know what it is we are trying to manage” rather than not knowing much of anything about the weight of our fresh heifers (i.e., being blind as to what is going on).
Relationship between first-lactation cow weight and age at calving
Figure 2 shows the calving weight (in pounds) of first-lactation cows plotted against their age at calving (days) for calvings from January 2021 through December 2022. These are the same cows used for Figure 1, but here each dot represents an individual cow. As expected, the relationship between weight and age at first calving is positive. At time of first calving, older heifers tend to be heavier, all else equal. (Red line is linear slope of weight as a function of age.) While this might be an obvious point, it reminds us if we breed heifers at an earlier age, they will weigh less at calving. However, a second key point is there is a large amount of variation in cow weights not related to age, indicating the relationship between age and weight is not particularly strong. For example, for a given age (x-axis) there is a wide range of cow weights (y-axis) – cow weight often varies by 400 to 500 pounds for a given age.
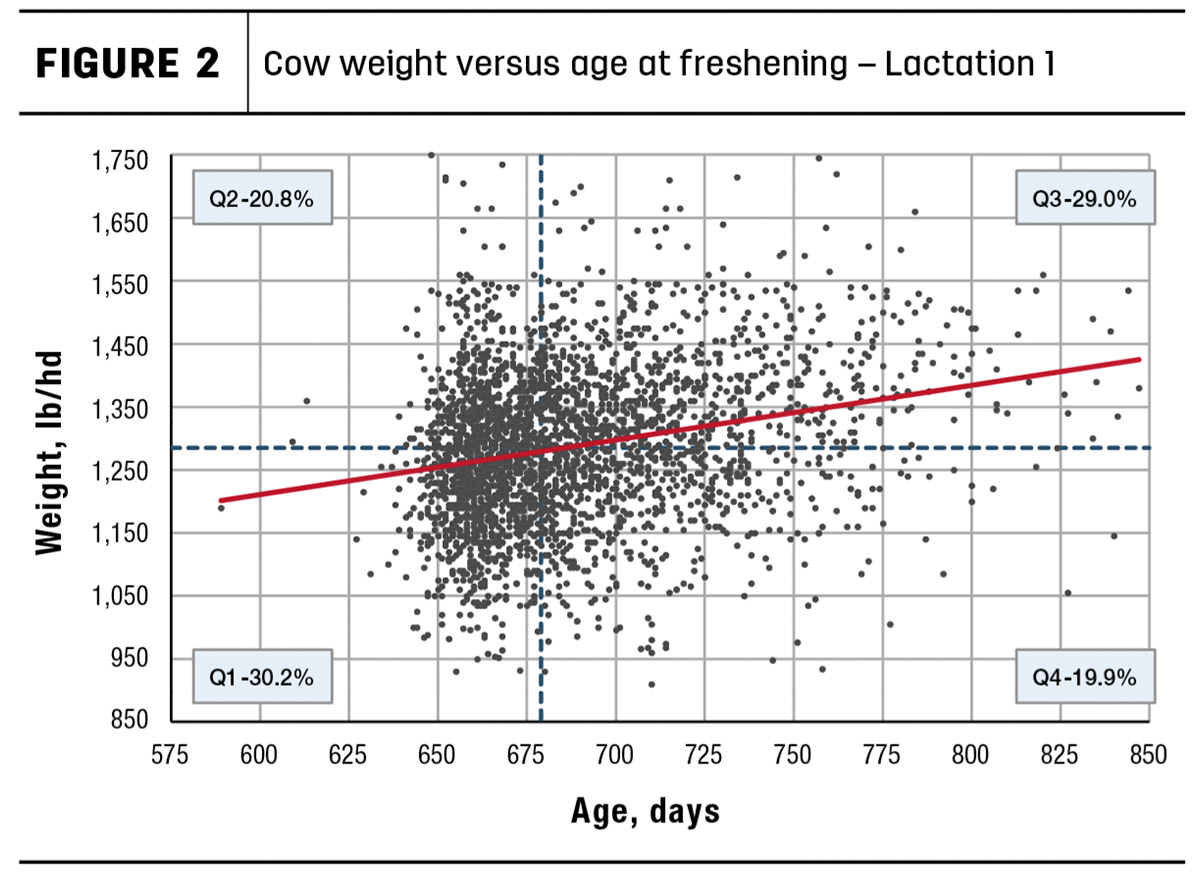
The horizontal and vertical blue dashed lines are at the median values for weight and age, splitting the figure into four quadrants. As expected, given the positive relationship between weight and age at calving, the majority of cows fall in the lower left (Q1) and upper right (Q3) quadrants (59.3% of cows). These quadrants reflect cows that are lighter than average because they are younger than average (Q1) and cows that are heavier than average because they are older than average (Q3). The interesting quadrants on this figure are Q2 and Q4, which together represent 40.7% of the cows that are better (Q2) or worse (Q4) than expected for weight based on their age. For example, cows in Q2 are heavier than average, but they are also younger than average. Conversely, cows in Q4 are lighter than average, but they are older than average.
Impact of cow weight and age at calving on key production metrics
A logical question is: How much does this weight variation matter for my dairy? It is important to address this question to estimate the benefits of collecting/recording this information compared to the costs of doing so.
To begin to address this question, multivariable models were estimated for milk production (milk at first, second and third test as well as peak milk), early removal (first 60 days) and first service outcome. Explanatory variables included in the models were age and weight at calving, calf outcome (female, male, twin), total primiparous calvings in week, disease in the first 30 days (yes or no for mastitis, metritis, retained placenta and displaced abomasum), days in milk at test or peak (milk models only), predicted transmitting ability for milk (excluded from first service outcome model), month fresh and year fresh.
Table 1 reports the model-predicted values where all explanatory variables were held constant at their means except age and weight at calving – they were evaluated at the averages of the four quadrants from Figure 2. The average age was similar for Q1 and Q2 (662 versus 664 days), but the average weight was 182 pounds heavier for cows in Q2, and this heavier weight was associated with 3.3 to 3.9 pounds per day higher milk production across the four metrics considered. (A 3.6 pounds per head per day advantage on a 330-day lactation equates to an extra 1,179 pounds of milk.) Comparing cows in Q2 versus Q3, their weights differed by only 21 pounds, but Q2 cows are 55 days younger, on average. Milk production for cows in Q3 showed a slight advantage (about 1.6 pounds per head per day) compared to cows in Q2, indicating a positive relationship with age, but it is a much smaller impact than weight. This small advantage in milk production is likely not sufficient to cover the additional cost of rearing the heifer an extra 55 days. Comparing cows in Q3 versus Q4 (similar age but over 200 pounds cow weight difference) showed a milk advantage of 3.7 to 4.2 pounds per day for the heavier cows.
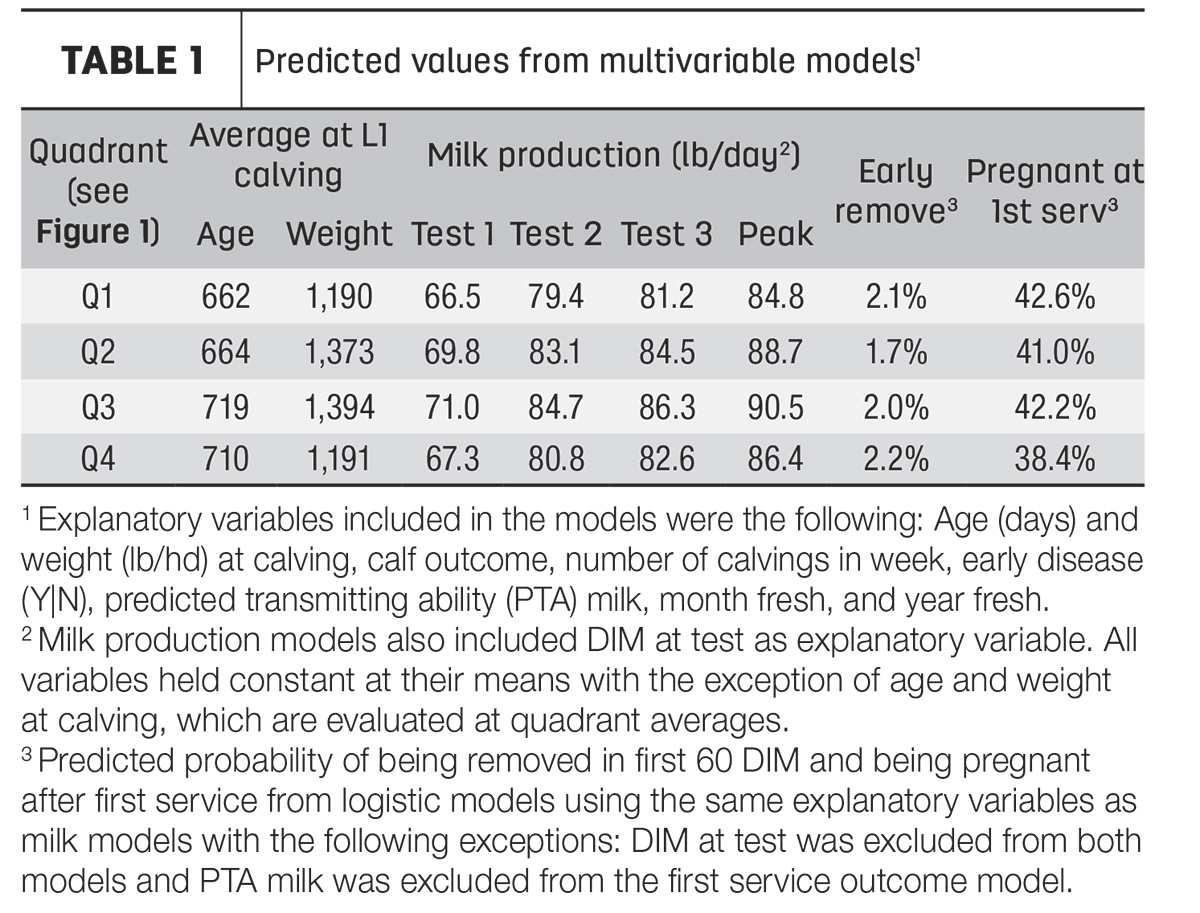
The probability of a cow being removed early was very low for this dairy, thus there were little differences across the different age and weight combinations considered. (None of the age or weight variables were statistically significant.) Numerically, the probability of being pregnant after first service was highest for cows in Q1 (younger and lighter cows) and lowest for cows in Q4 (older and lighter cows), but the age and weight variables were generally not statistically significant.
From the data in Table 1, it is clear having heavier heifers at first calving is beneficial for milk production, and obviously if this can be accomplished with younger animals it likely can help keep heifer rearing costs lower. The worst type of cows to produce are those that fall in the lower right quadrant (Q4) – lighter than average but older than average – as their milk production is lower and their increased age suggests a higher rearing cost. Based on some very simple assumptions, a cow falling in Q4 would conservatively be about $160 less profitable after her first lactation than a “median cow” (based on 1.1 pounds per head per day less milk at $18 per hundredweight (cwt) and 31 more days to fresh at $3 per head per day).
Predicting cows that fall in the lower right (Q4) quadrant
Variation naturally exists, so there will always be a certain number of cows in Q4. But does data exist to help us identify those cows earlier on, so we produce fewer of these cows? Knowing which of the weight x age quadrants a cow falls into once she calves isn’t particularly helpful, as it is too late to make meaningful management decisions. Likewise, knowing which quadrant she might fall into 30 to 90 days prior to calving isn’t very helpful either, as little can be done to change that. Thus, to be helpful for making management decisions, it is desirable to predict which of the quadrants a heifer is expected to fall into at calving as early as possible in the heifer-rearing process (ideally prior to breeding decisions).
The driver of whether a cow falls into an acceptable quadrant in Figure 2 is weight gain, as all cows age at the same rate. What are good predictors of a cow’s weight at calving? As previously pointed out, there is a lot of variation in cow weight independent of her age. Being able to measure and record all the information that affects this variability is likely not possible. However, a couple of potential “early indicators” of the weight of a cow at calving are whether she had any health issues and/or how well she is growing early on. While these two factors are inversely related (calves with health events tend to have slower growth rates), most dairy producers do not routinely individually weigh their heifer calves; thus it might be that recording health events is a useful proxy for growth.
As previously discussed, the dairy of this analysis records calf birthweights, and calves are routinely weighed at multiple times. The first weight is taken at around 3 months old (approximately 88 days with range of 70 to 110), and the second weight is at around 6 months old (approximately 180 days with range of 160 to 200). Of the roughly 3,000 cows represented in Figure 2, 80% of them had weights at these two times. A logistic model was estimated including birthweight and early growth (i.e., ADG in first three months and ADG in next three months) to predict if a cow was likely to fall in the Q4 quadrant based on these variables. Both birthweight and average daily gain were statistically significant predictors and had the expected direction (i.e., heavier calves at birth and those that gained faster early in their life had a lower probability of falling in the Q4 quadrant), but the model’s prediction accuracy was quite poor. That is, while these weight measures are important, there are many other factors that need to be considered.
Summary
So, what is the take-home point for this dairy? I would contend that weighing cows provides useful information to identify how it relates to important economic metrics, and knowing this information will be useful to make improvements over time. Likewise, weighing calves provides information that helps identify cows that will be poor performers. But at this time this information, by itself, appears less valuable for this dairy given the calf weight information is weakly related to weight at calving. If the dairy has been using this early growth information to make heifer culling decisions prior to breeding, that changes the story, as this analysis has been conducted with a survivor-biased sample.
As this article started, there are many things managed on a dairy that have not been measured. But I would contend measuring things, specifically weighing cows and calves, and accurately recording health events, can help improve management decisions. It also forces us to keep asking more questions, which is how we all improve over time.


