
Recently, producers at the Nebraska Grazing Conference indicated that there is still a lot of apprehension around the use of NIRS in forage evaluation. The most common concern was that near-infrared reflectance spectroscopy (NIRS) is “fine” for alfalfa but not accurate enough for grass forages.

One attendee of the conference was retired University of Nebraska Forage Specialist Dr. Bruce Anderson. As a champion of forage testing and NIRS, he specifically questioned how warm- and cool-season grasses appeared in today’s calibrations. He thought it was likely that warm-season grass formed a cluster, while cool-season grass formed another cluster. He thought it was possible that the calibrations were being forced based on these clusters of data. Anderson said he would like to see warm- and cool-season grasses plotted together to know if his hunch was correct. The concern about differences in warm- and cool-season grasses is something that has been discussed at other forage meetings.
Further concerns around NIRS analysis were also brought up at the International Grassland Conference held in Kentucky last May. Conversations hinted that calibrations should be specific to geographical location.
For this investigation, we have chosen to look at the grass hay calibration created by the NIRS Forage and Feed Consortium (NIRSC), which collects samples from various member laboratories in different geographical locations for calibration development. Therefore, the dataset includes large numbers of both warm- and cool-season grasses, representing a nationwide geography of forages. Figure 1 shows the calibration database samples plotted.
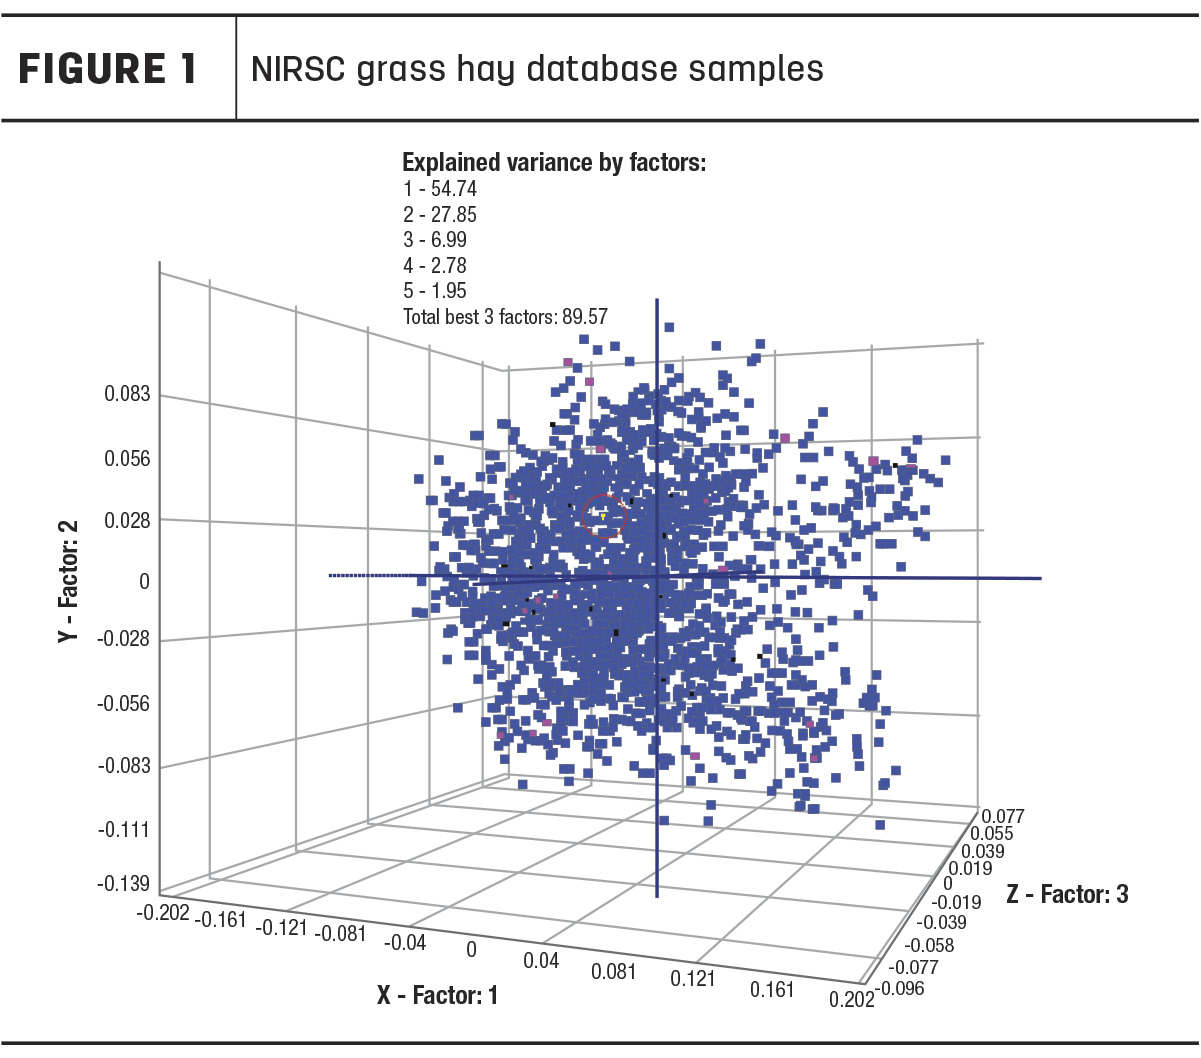
In this 3D graph, it does not appear that there are separate clusters within the database of warm-season and cool-season grasses, nor separate clusters with geographic influence. A NIRS calibration created with this sample set is likely to have good prediction accuracy across a range of grass samples. This illustrates that the idea that a NIRS calibration must be specific to your geographical region is a false belief.
As long as there are samples used in the development of the calibration similar to those you are trying to analyze, NIRS can be very accurate. If not, you will not see accuracy. The industry runs into trouble when comparing results from different laboratories for this reason. One lab may have used a small number of samples with little range from one geographic location to build a calibration. Therefore, when a sample is presented for analysis that is nothing like those samples, the calibration cannot provide accurate analysis. This is not a flaw of the technology but rather an indication of how it needs to be properly applied and utilized.
Ward Laboratories Inc. decided to also look at outlier sample data. Wet chemistry was run in a single replication for crude protein (CP), acid detergent fiber (ADF) and amylase-treated neutral detergent fiber (aNDF) on grass samples with a NIRS global H statistic value above 3.00, calling these samples “outliers.” Global H indicates the spectral distance, or how close that sample is to the mean spectrum of the samples included in the NIRS calibration database. (Global H should not be interpreted as a relative measure of accuracy, but rather as a statistical guideline for how well a sample may fit when compared to the calibration sample set).
First, looking at the overall performance of the NIRS calibrations, the data was plotted with NIRS-determined values on the y-axis and wet chemistry-determined values on the x-axis (Figure 2) to illustrate how well the two values correlated.
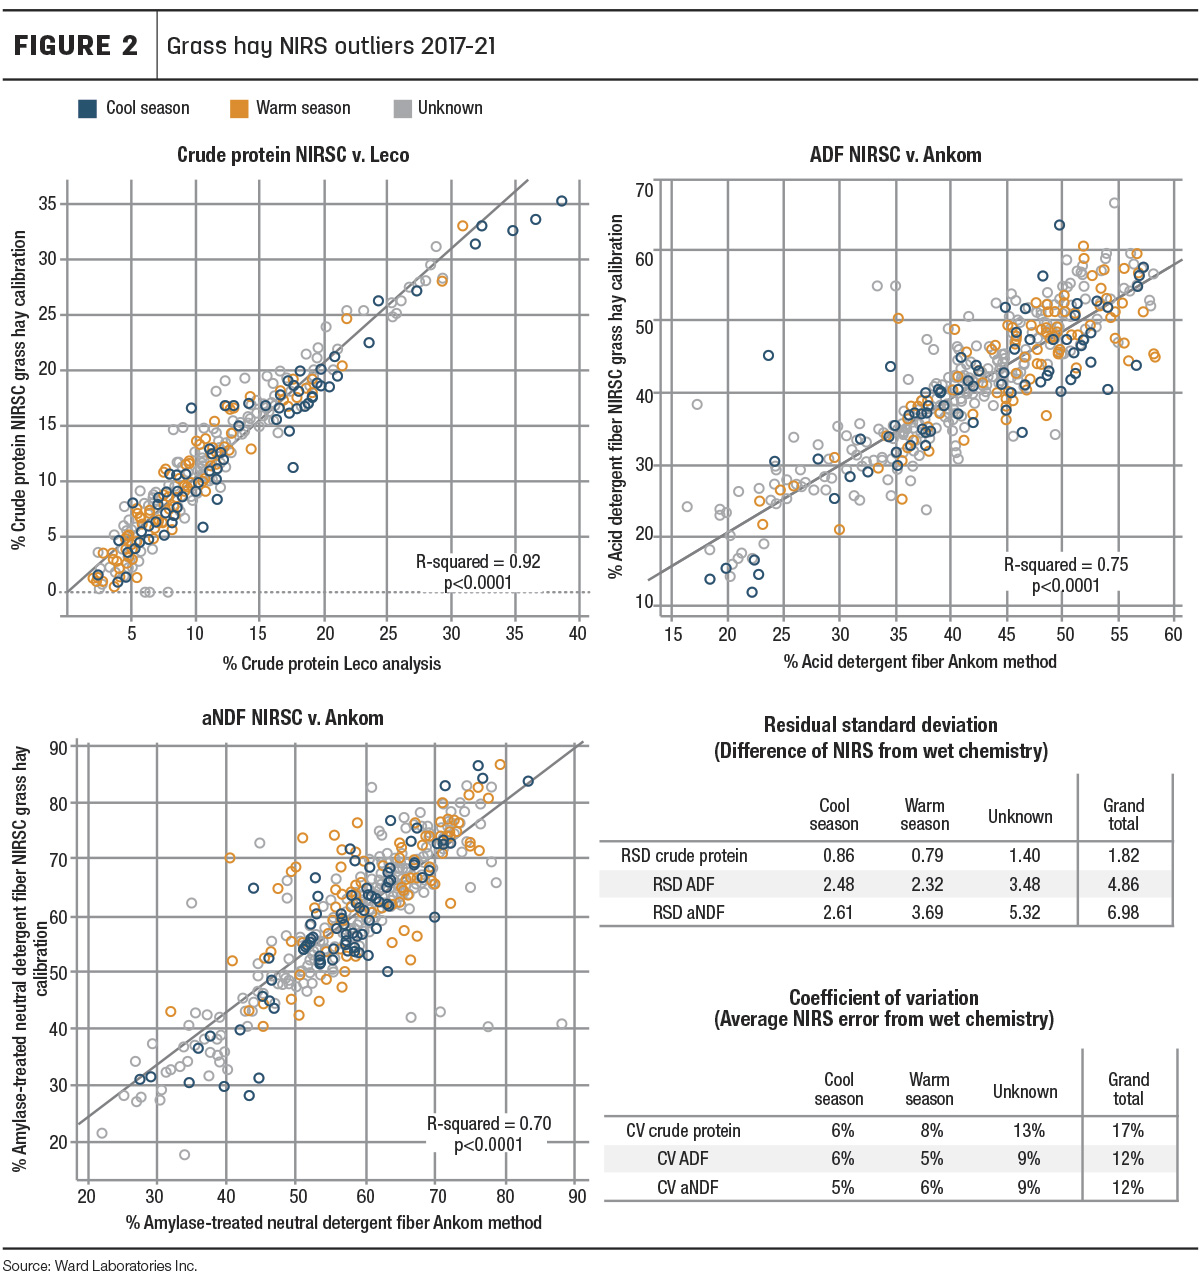
Crude protein had the highest correlation of NIRS-determined values and wet chemistry-determined values (R2 = 0.92). Fiber NIRS and wet chemistry also correlated with R-squared of 0.75 and 0.7 for ADF and aNDF, respectively. Furthermore, the overall coefficients of variation (Figure 2) were between 10%-20%, which would be considered acceptable in the evaluation of the calibrations. Additionally, it should be noted that Ward Laboratories Inc. uses filter bag methods for fiber analysis, while the NIRSC fiber-reference chemistry analysis follows the Association of Official Analytical Chemists (AOAC) official method 2002.04. Therefore, this is not truly a fair evaluation of accuracy but does indicate that, even with outlier samples and varied chemistry methods, NIRSC grass calibrations still performed well in the prediction of these nutrients.
Next, species were categorized as warm-season, cool-season or “unknown” to evaluate warm-season versus cool-season grass NIRS accuracy. Most samples were unknown, as many producers simply submitted samples labeled as “hay” or “grass hay.” For producers who did specify species, we categorized millet, sudangrass, forage sorghum, sorghum-sudan hybrids, buffalograss, little bluestem, big bluestem and switchgrass as warm-season grasses. Cool-season grasses included rye, triticale, oats, wheat, fescue, brome, barley, orchardgrass and others labeled as “bunch grass.”
Figure 2 shows the warm-season grasses (orange) and cool-season grasses (blue) appear to be dispersed evenly throughout the data points. They do not appear to be clustering together. Furthermore, warm- and cool-season grasses had very similar relative standard deviation (RSD) and coefficient of variation (CV) values.
It should also be noted that samples compiled from Ward Laboratories’ database also represent a wide geographic region. Samples seen in Figure 2 were submitted from California, Colorado, Iowa, Kansas, Missouri, Montana, Nebraska, Oklahoma, South Dakota and Wyoming.
In conclusion, not only are NIRSC calibrations accurate for the evaluation of grass-type forages, but they successfully combine warm- and cool-season grasses, eliminating the need for separate calibrations. Perhaps the hesitations out there can be attributed to a lack of knowledge surrounding NIRS technology, rather than the technology itself. When used appropriately, it is an effective and accurate analysis tool. It is important to understand that each NIRS calibration is separate from one another. For example, a forage lab could create its own calibrations, use NIRSC calibrations or use purchased calibrations from an instrument vendor. It is often overlooked that the actual samples used in the calibration dataset contribute to and determine a NIRS calibration’s overall accuracy. Therefore, each NIRS calibration should be evaluated separately, rather than in generalized assumptions.


