The historical mindset in measuring a dairy cow’s productivity is to look at pounds of milk produced per cow. As we all know, productivity measured in those terms has increased significantly over the years and continues to do so. Average U.S. milk production per cow has doubled in the past 50 years. But are the components in the milk – fat, protein and solids-not-fat – increasing along with milk pounds?

It is the components in milk that give milk its functional, nutritional and thus economic value. Without milk components, milk has little or no value. In manufactured products such as cheese and powder, the higher the component percentages, the greater the yield of finished product per given amount of milk.
When used for fluid purposes, the higher the component level, the more nutritious the milk. If we increase a cow’s milk production but do not increase the components in the milk, we have not increased the economic productivity of the cow.
Increasing milk pounds without increasing milk components means we end up transporting more liquid carrier, or white water, along with the same components. Manufacturing plants spend more energy and money separating milk components from white water.
When consumed in fluid form, without an increase in components, a consumer must drink more milk to receive the same nutrition.
And with all of today’s focus on reducing the carbon footprint, increasing milk pounds without increasing milk components, does little for that effort. Again, it is the components in milk that give milk its economic value.
The good news is: Yes, milk components have increased with milk production.
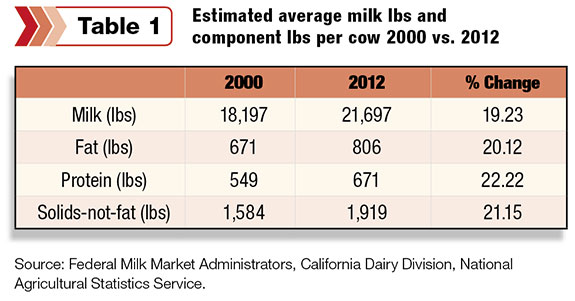
The better news is that components have increased more than milk pounds in the past 12 years ( Table 1 ).
From 2000 to 2012, the average U.S. dairy cow increased milk production 19.23 percent.
But component production increased even more during this time period. Fat production increased 20.12 percent, protein 22.22 percent and solids-not-fat production 21.15 percent.
Note: Annual milk component (fat, protein and solids-not-fat) data on a majority of the nation’s milk production was not available until Jan. 1, 2000. This is when most milk regulated by federal milk orders was priced using multiple component pricing.
Now let’s convert the milk components into pounds of cheese and nonfat dry milk powder, which helps us see more clearly the increasing productivity of the U.S. dairy cow. In 2000, milk from the average U.S. dairy cow was predicted to yield 1,830 pounds of cheddar cheese.
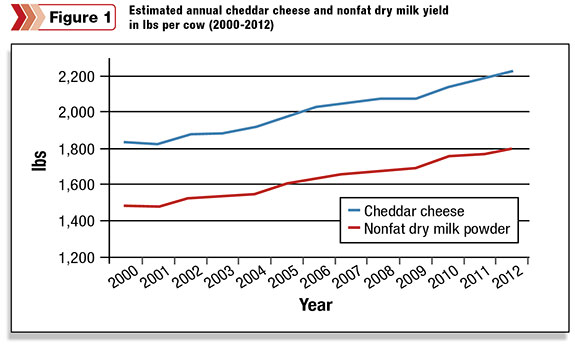
In 2012, the estimated cheese yield increased over 21 percent to 2,216 pounds.
For nonfat dry milk powder, the predicted yield increased over 21 percent as well from 1,482 pounds per cow in 2000 to 1,794 pounds in 2012 ( Figure 1 ).
In just 12 years, the productivity of the average U.S. dairy cow, expressed in terms of cheese and powder yield, increased over 21 percent.
Lowering carbon footprint and greater efficiency
Fat, protein and solids-not-fat production increased more than milk pounds due to higher milk composition.
From 2000 to 2012, based on the data compiled from the sources mentioned above, the estimated average fat percentage of the nation’s milk production increased from 3.69 percent to 3.72 percent, protein increased from 3.02 percent to 3.09 percent and solids-non-fat from 8.71 percent to 8.84 percent.
Because of higher milk composition, estimated cheddar cheese yield per hundredweight (cwt) went from 10.05 pounds per cwt in 2000 to 10.21 pounds in 2012. Nonfat dry milk yield went from 8.14 to 8.27 pounds.
These increases may not appear significant, but they are. Using cheese as an example, let’s show why. In 2012, the U.S. manufactured 10.9 billion pounds of cheese. We estimate it took the milk from about 4.9 million dairy cows to produce this cheese.
If the nation’s dairy herd in 2012 had the same component yield as was in 2000, it would take 5.9 million dairy cows to produce 10.9 billion pounds of cheese.
In other words, because of the U.S. dairy herd’s increased component yield, one million fewer cows were needed to produce 10.9 billion pounds of cheese compared to component yield remaining the same as in 2000.
Consider all of the savings, efficiency gains and reduction in the carbon footprint from manufacturing 10.9 billion pounds of cheese from 4.9 million cows versus 5.9 million cows. This is a major productivity gain. Similar savings would occur in the powder industry as well.
Future considerations
Better genetics and management are reasons for increased dairy cow productivity, along with the shift from skim-butterfat to multiple component pricing.
Multiple component pricing increased the awareness of milk components and provides dairy farmers the direct economic incentive to produce more milk components.
A review of sire summaries today compared to 10 to 15 years ago shows more sires with higher transmitting abilities for fat and protein compared to milk. In addition, many cheese plants encourage dairy farmers to deliver milk with high component levels.
With more milk each year used to produce manufactured dairy products, the growing focus on reducing the industry’s carbon footprint and increased global competitiveness, the dairy industry must do even more to increase its productivity, especially milk components. Let me offer the following three considerations:
1. Move from reporting a cow’s performance in pounds of milk to pounds of milk components. Report a dairy cow’s productivity on what gives milk its economic value.
2. Many plants and cooperatives provide monetary incentives to dairy farmers to produce more pounds of milk. Change these incentives to milk components. Give dairy farmers the incentive to produce what gives milk its economic value.
3. Provide an economic incentive to dairy farmers to produce the maximum amount of milk components in the least amount of volume. The world’s leading exporter, New Zealand, uses such a plan. New Zealand pays for milk components but also deducts for volume.
New Zealand learned many years ago the manufacturing savings resulting from using milk with the most components in the least amount of volume.
During the 2011-2012 season, New Zealand dairy cows produced milk averaging 4.99 percent fat and 3.82 percent total protein (U.S. measures true protein).
Because of the higher composition, a New Zealand plant manufacturing whole milk powder will yield about 2 pounds more of powder per cwt of milk than a U.S. whole milk powder would. The higher yield gives New Zealand plants a significant competitive advantage.
During the past 12 years, the U.S. dairy cow significantly improved production of milk components – what gives milk its functional, nutritional and thus economic value.
Going forward, the dairy industry must further emphasize and incentivize the production of milk with the maximum of milk components in the least amount of volume. Such effort will further improve the efficiency, profitability, sustainability and competitiveness of the U.S. dairy industry. PD
Calvin Covington is a retired dairy co-op CEO.

Calvin Covington
Retired Dairy Co-op Executive