What is precision feeding? Precision can be defined as being exact – neither more nor less. Precision feeding approaches will vary from farm to farm and has different understanding by dairy farmers and their nutritionists.

One challenge is to deliver the same diet from day to day on the farm. Guidelines for precision feeding are listed below.
- Provide a consistent physical and chemical ration
- Consistent flow of nutrients through digestive tract
- Remove variation
Minnesota workers’ definition of precision feeding includes meeting a cow’s nutrient requirements so nutrient availability does not limit her performance in an economically viable and environmentally sustainable way. Precision feeding may mean minimizing feed costs to produce milk, feeding to optimize milk component yield and/or managing nitrogen and phosphorus excretion.
On-farm applications of precision dairy nutrition could increase productivity, efficiency and profitability. Spain workers reported that management aspects including age at first calving, amount of feed refusals, number of feed push-ups and cow stocking density explained more than 55% of the variation in milk production observed in 47 herds feeding the same total mixed ration (TMR). If a herd has a management limitation, adopting precision technologies will not solve it.
Provide a consistent physical and chemical ration
Several factors can be involved with consistent rations. Physical consistency focuses on the accurate mixing of feed ingredients with TMR, order of adding feed ingredients and mixing times. Dry matter intake (DMI) can be a problem, as dry matter content in rations can change due to changes in forage dry matter because of in-field forage variation, impact of rain and snow in bunker and pile storage systems, and inaccurate weighing of feed ingredients. Testing on-farm dry matter content of forages and TMR allows for adjustments and corrections in feed ingredient inclusion.
Another approach is to use the Penn State Separator Box (PSPB) to evaluate the physical form consistency of the TMR. Measure several places along the feedbunk to determine particle length uniformity. Guidelines for a lactating high group TMR (three-box unit) is 3% to 8% in the top box (0.75-inch-diameter openings), over 50% in the middle box (0.3-inch-diameter openings) and less than 45% in the bottom pan.
If any box varies by more than 5 percentage points, determine the source of variation (sorting by cows, order of adding feeds in the TMR mixer, pre-processing long forage to less than 1 inch, length of time mixing before feeding and accuracy of the correct feed amounts).
Chemical consistency tests variation in feed ingredients (especially forages and wet byproduct feeds). Concentrates such as corn and soybean meal do not vary as much compared to forage. Ohio State University workers suggest averaging three to five of the most recent forage test results of each forage in the ration to reduce variation and reflect the “true” nutrient value of that forage.
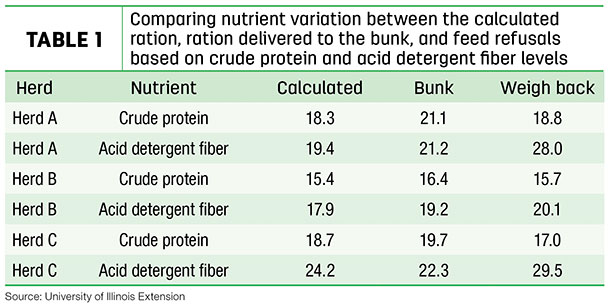
Changing forage nutrient content based on one test result can result in errors due to sampling error, for example. Forage testing labs may provide these averaged values for your forages. Testing the TMR can also reflect consistency. The 1-2-3 rule compares ration nutrient levels calculated by your computer-based feeding program, diet delivered in the feedbunk and weighbacks or feed refusals. Table 1 reflects three herds in Illinois over a three-month period.
- Rule 1 is plus or minus 1 percentage protein point. (Example: Calculated protein target is 16.1% with an acceptable range of 15.1% to 17.1% in the diet ration in the bunk.)
- Rule 2 is plus or minus 2 percentage ADF points. (Example: Calculated ADF target is 20.5% with an acceptable range of 18.5% to 22.5% in the diet ration in the bunk.)
- Rule 3 is plus or minus 3 percentage dry matter points. (Example: Calculated dry matter target is 52% with an acceptable range of 49% to 55% in the diet ration in the bunk.)
Dairy farmers and nutritionists can modify the nutrient range if they want more precision and focus on other nutrients such as neutral detergent fiber (NDF) or starch. Table 1 reflects sorting against forage fiber in herds A and B with higher acid detergent fiber (ADF) values.
Herd B has the best profile of the three Illinois participating farms. Herd A illustrates differences between calculated ration and ration delivered to the bunk. Protein levels are high in herds A and C, reflecting 1980 recommendations by their nutritionists.
Tools for fine-tune precision feeding
Tools to improve the precision of feed ingredients reflecting an optimal balance meeting the cow’s nutrient needs are listed below.
- Metabolizable protein (MP) level determines optimal levels of rumen bacterial amino acids and rumen-undegraded protein (RUP) levels from feed ingredients. Review if the ration meets the amino acid needs (grams per day) with a ratio of 2.7 grams of metabolizable lysine to each gram of metabolizable methionine.
- Milk urea nitrogen (MUN) is analyzed on every load of milk leaving the farm. Average the MUN tests over a week and compare to other weekly averages to determine if changes or trends are occurring. Target MUN values between 8 to 12 milligrams per deciliter. Changes of 2 MUN points can reflect if the ration nitrogen and/or carbohydrate levels have changed.
- The level of rumen-fermentable carbohydrates (RFC) reflects energy sources of rumen microbes. Optimal RFC values from 38% to 41% include starch (23% to 28%), sugar (6% to 7%) and soluble fiber (8% to 11%). Add the level of each source. (Example: 25% starch, 6% sugar and 8% soluble fiber results in 39% in the ration.) With expensive corn, it is possible to substitute starch with more sugar in the example, such as 23% starch and 8% sugar.
- Corn silage kernel processing score (KPS) is measured in commercial labs. The lab will determine the percent of kernels that pass through a screen on their shaking device.
The recommended score is over 70% passing through the screen. For each 10% drop in KPS score below 70%, you can lose 2 pounds of milk per cow per day, as the starch is not available to be used by the cow. For example, if your KPS was 50% instead of over 70%, you can lose 4 pounds of potential milk yield. Your kernel processor on the silage chopper was not correctly set to crush corn kernels (a risk with drier corn silage over 34% dry matter and/or drought-stressed corn plants).
- Fecal starch testing can be analyzed in commercial labs to determine the level of starch remaining in manure. It is an indirect test, as we do not know the actual amount of starch consumed by the cow. Wisconsin guidelines are levels below 3% fecal starch is optimal, 3% to 5% is a concern, and over 5% is a problem. Each 1% increase in fecal starch can result in 0.6 pound less milk. Evaluate all starch sources in the diet including corn silage, corn grain, byproduct feeds and cereal silages.
On-farm challenges and opportunities
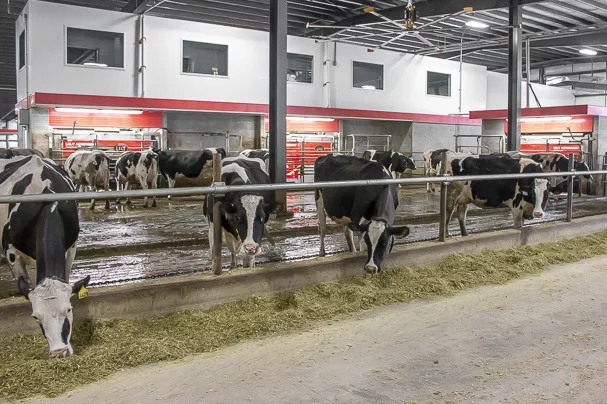
The number of groups can be a limitation (for example, all dry cows in one group and all lactating cows in one group) due to cow numbers, moving cows to the milking parlor and/or pen availability. Adding groups allow the nutritionist to be more precise meeting the nutrient requirements of cows. Size of the group can be another challenge, as the variation between cows in the pen or farm reduces the ability to deliver precise diets.
The standard deviation within a group or herd of lactating cows can be 10 to 15 pounds of milk or more. This value can be used to set the target level of milk in the group or herd. (Example: The herd average is 75 pounds of milk plus 11 pounds of milk – one standard deviation which can result in balancing at 86 pounds of milk.) One standard deviation is plus and minus two-thirds of the cows in the group. Higher-producing cows will need to consume more dry matter, while lower-producing cows may consume excessive nutrients, leading to heavy cows and higher feed costs. Several grouping examples to improve nutrient precisions are listed below.
- Dry cow group: Far-off cows with optimal body condition score (3 to 3.25)
- Dry cow group: Far-off thin cows with body condition under 3 (adding energy)
- Dry cow group: Springing heifers (allow for growth, pregnant and udder development)
- Dry cow group: Close-up cows (one group for springing heifers and one for cows)
- Fresh cow group: Two groups – one for first-lactation cows and one group for second-and-greater-lactation cows
- Lactation group: First-lactation cows
- Lactation group: High-producing cows (could be multiple pens depending on herd size and facilities)
- Lactation group: Middle-lactation cows (could be multiple pens)
- Lactation group: Low-lactation cows (body condition scores over 3.25)