The USDA’s National Agricultural Statistics Service released latest 2023 hay production and inventory estimates at the Progressive Forage deadline. With those numbers in mind, here’s a look at hay markets and conditions.

- Production of all dry hay was estimated at 119 million tons, up 6% from the 2022 total. Area harvested was estimated at 52.8 million acres, up 8%, with yields averaging 2.25 tons per acre.
- Production of alfalfa and alfalfa-mixture hay was estimated at 49.9 million tons, up 2% from the 2022 total. Harvested area, at 15.6 million acres, was up 3%, and average yield was estimated at 3.19 tons per acre, down 0.03 ton.
- Production of other hay in 2023 totaled 68.9 million tons, up 9% from the 2022 total. Harvested area, at 37.2 million acres, was up 11%, with average yield estimated at 1.85 tons per acre, down 0.02 ton from 2022.
- Growers seeded 1.74 million acres of alfalfa and alfalfa mixtures during 2023, up 4% from 2022.
Watch for state and regional details regarding hay and forage production in Progressive Forage’s upcoming annual forage statistics insert.
Winter hay inventories mixed
With the 2023 hay crop in storage or market transit, hay inventories stored on U.S. farms as of Dec. 1, 2023, were up about 7% from a year earlier. Among major dairy states, hay inventories were estimated about 1.5% lower.
All hay stored on U.S. farms was estimated at 76.7 million tons, up almost 5 million tons from a year ago. Among the 24 major dairy states, on-farm hay inventories were estimated at 39.4 million tons, down 600,000 tons.
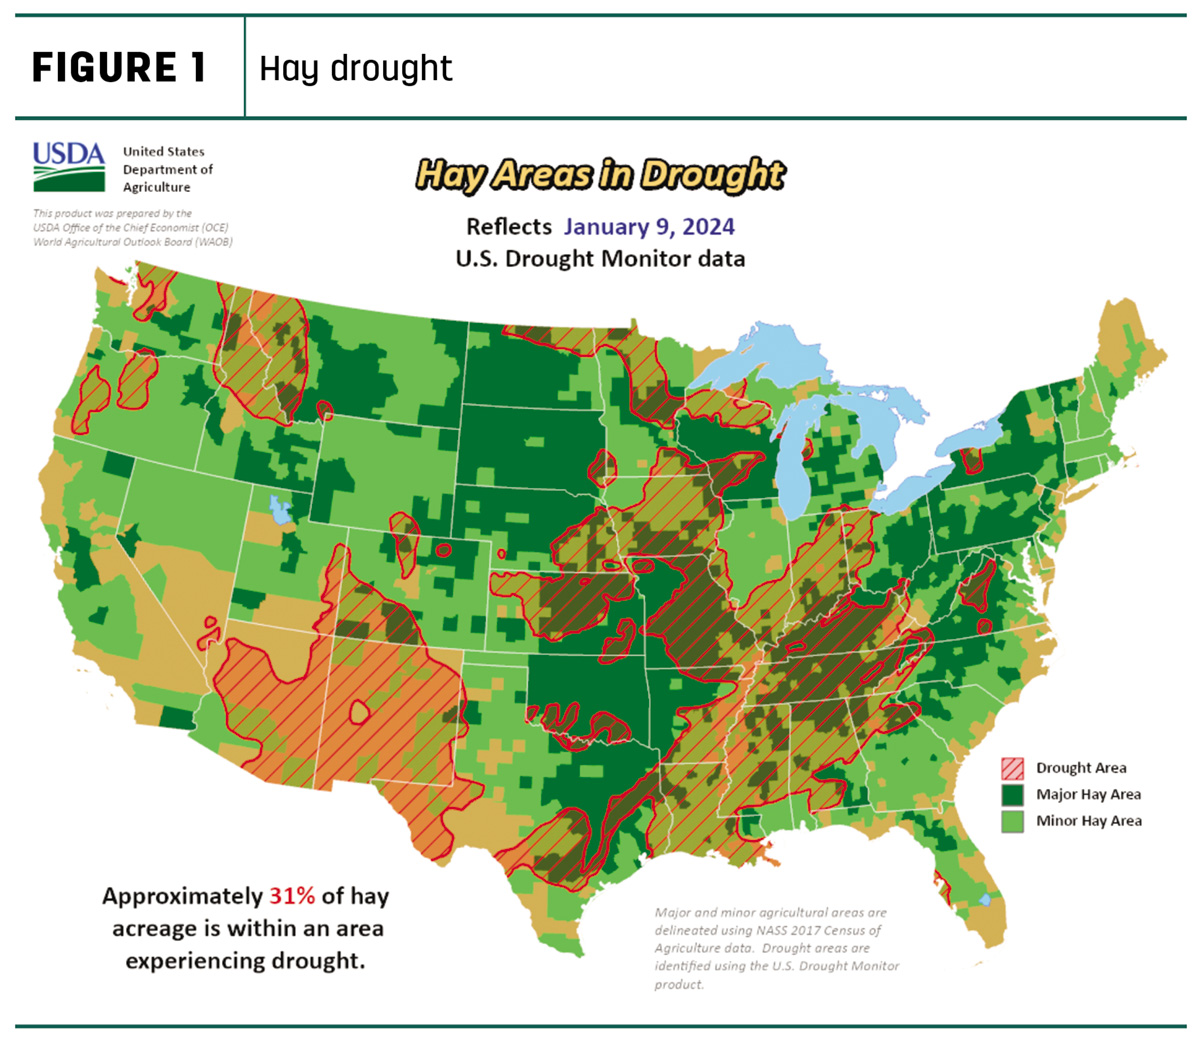
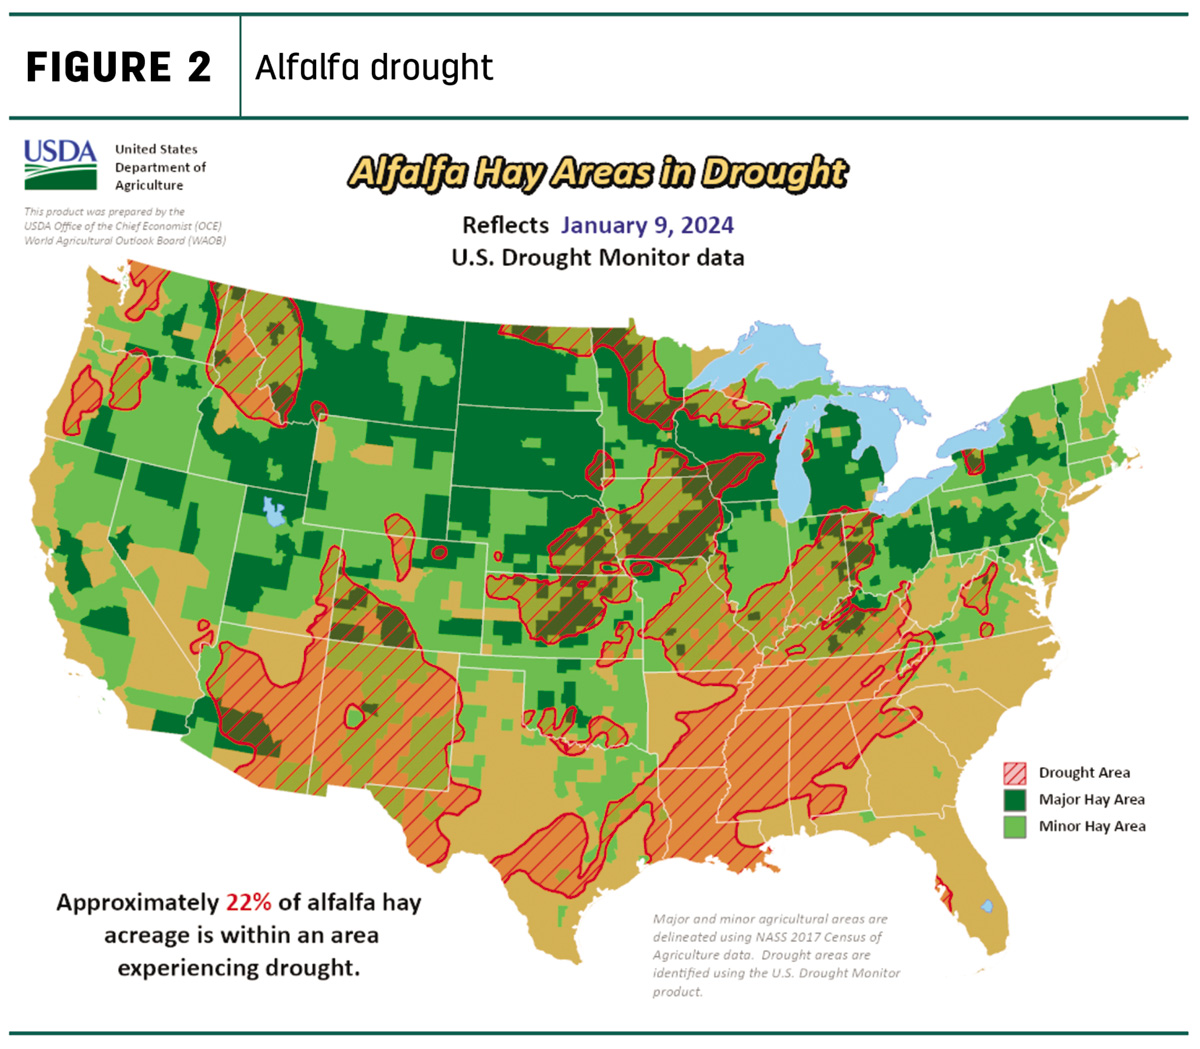
Moisture conditions mapped
U.S. Drought Monitor maps indicate little change in drought areas compared to a month earlier. As of Jan. 9, about 31% of U.S. hay-producing acreage (Figure 1) was considered under drought conditions, 3% less than a month earlier. The area of drought-impacted alfalfa acreage (Figure 2) was estimated at 22%, up 1% from early December.
In early January, snow water equivalent (SWE) levels were rated low across nearly the entire western U.S. While storms forecast in the coming weeks were expected to improve conditions in the Pacific Northwest, Great Basin and northern Rockies, they were unlikely to completely erase existing SWE deficits.
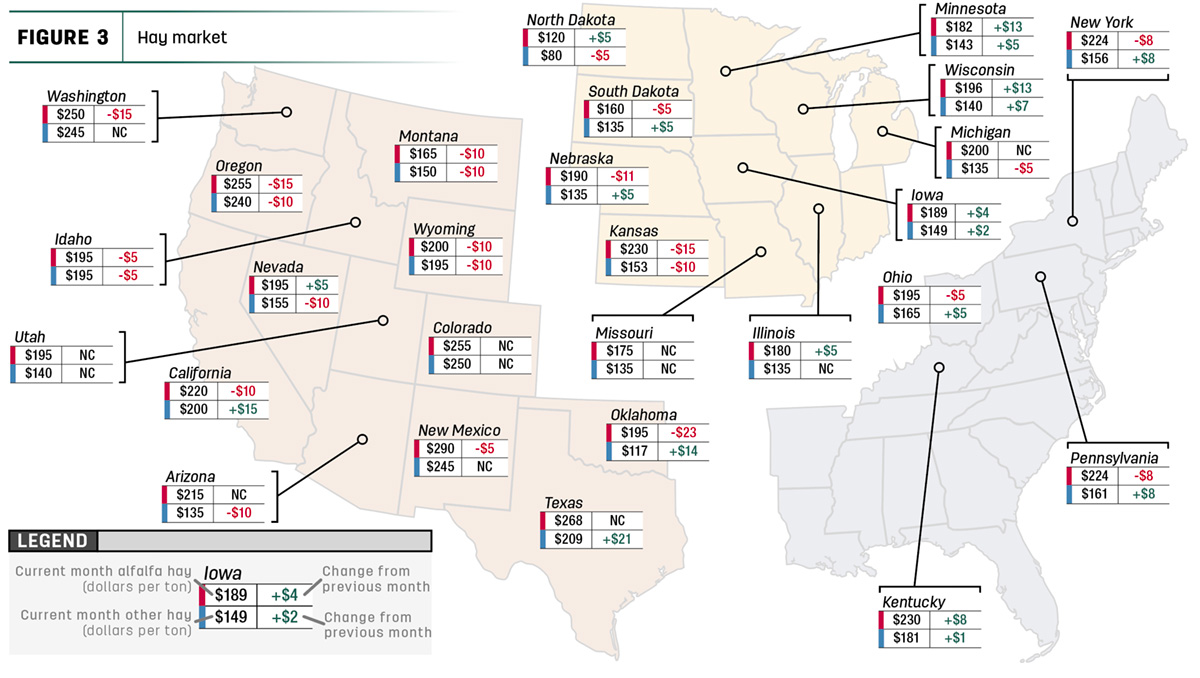
Hay prices tracked
Price data for 27 major hay-producing states is mapped in Figure 3, illustrating the most recent monthly average price and one-month change. The lag in USDA price reports and price averaging across several quality grades of hay may not always capture current markets, so check individual market reports elsewhere in Progressive Forage.
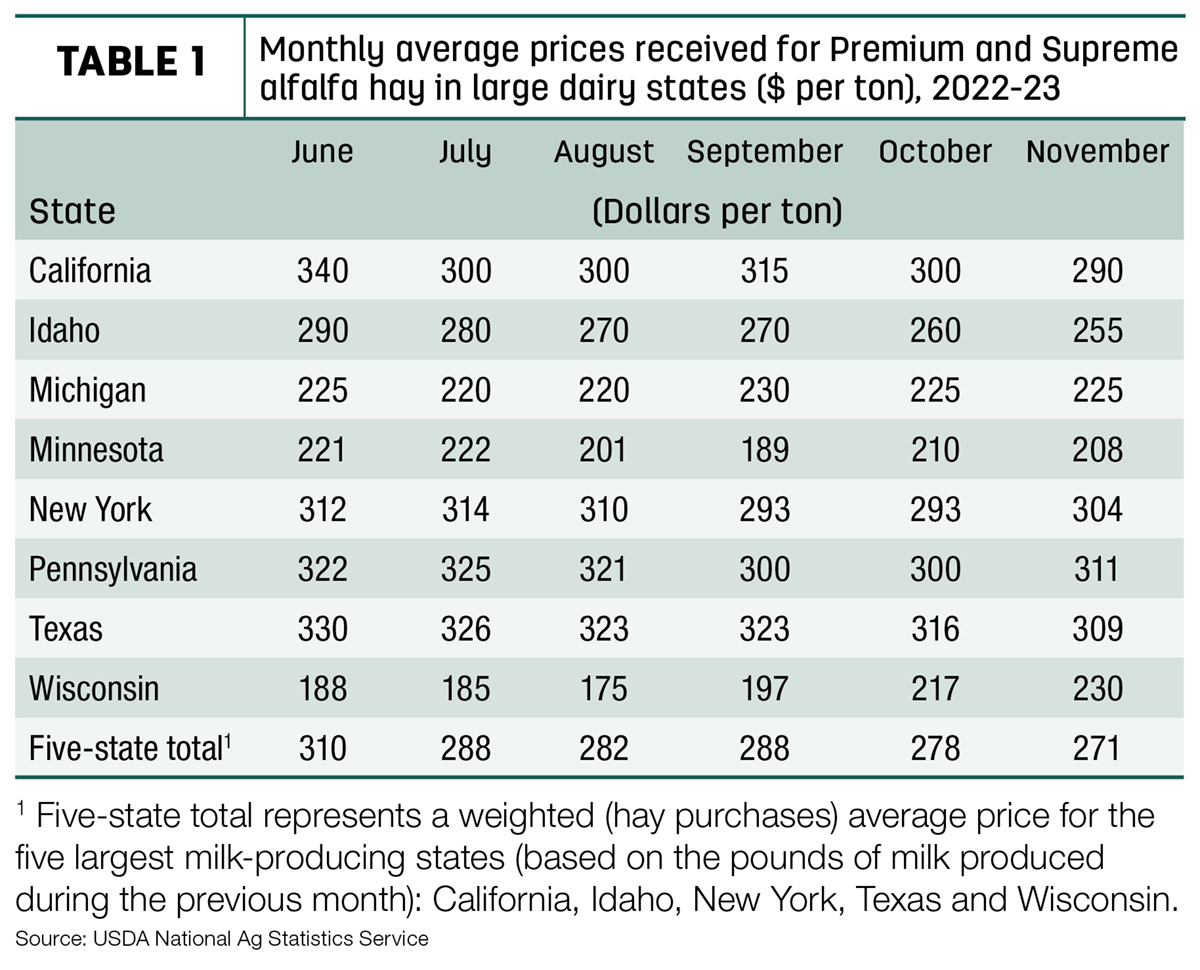
Dairy hay
At $271 per ton, November’s average price for Premium and Supreme alfalfa hay in the top milk-producing states declined $7 from October to a 20-month low and was $60 less than a year ago (Table 1).
Alfalfa
The U.S. average price for all alfalfa hay dipped $10 in November to $207 per ton, the lowest average price since August 2021. Compared with October, prices rose in seven of 27 major forage states, led by increases in Minnesota and Wisconsin. Prices were lower in 14 states, with Kansas, Oregon, Washington and Oklahoma all down $15 or more, and unchanged in six other states. Year-over-year prices were down $115 or more in Utah, Nevada, California and Arizona.
Other hay
At $170 per ton, the November 2023 U.S. average price for other hay was up $6 per ton from October. Prices increased in 12 of 27 major hay-producing states, with largest month-to-month increases in Texas, California and Oklahoma. Prices declined in 10 states, with average prices down $10 in Arizona, Kansas, Montana, Nevada, Oregon, Utah and Wyoming.
The November 2023 U.S. average price for other hay was down $14 per ton from a year earlier, led by declines of $110 in Arizona and Utah and $155 in Nevada. Texas and Wisconsin recorded increases of $34 and $24, respectively.
The spread between U.S. average alfalfa and other hay prices – at more than $100 per ton last May and June – shrunk to $37 per ton in November, the slimmest gap since the first quarter of 2021.
Hay exports pick up
The pace of alfalfa hay exports picked up a little in November, but year-to-date sales remain at a nine-year low. Monthly exports were estimated at 199,440 metric tons (MT), bringing the January-November total to just under 1.97 million MT. November sales to China rose to 99,400 MT, a high for the year. Sales to Japan totaled 34,839 MT, a six-month high.
November exports of dehydrated and sun-dried alfalfa cubes (8,000 MT) were a three-month high, with Japan representing the vast majority of the market.
At 98,815 MT, November exports of other hay held steady for a third straight month. The year-to-date total is 911,398 MT, still well below averages for the January-November period extending back two decades. Japan maintained its spot as the top market, taking about 50% of other hay shipments (49,500 MT) during the month, a high for the year. November sales to South Korea were steady at almost 32,000 MT, 32% of the total.
Regional markets
- Southwest: In California, trade activity was slow. Retail hay demand was moderate; dairy and export hay demand was slow.
In Oklahoma, demand remained low, and most hay producers were only delivering to long-time customers. Many producers were interested in seeing if winter storms will help move the hay market.
In Texas, hay prices were mostly steady to firm; trading activity was moderate on moderate to good buyer demand. Most hay movement was previously contracted hay. Current winter weather forecasts are likely to slow hay movement, even as demand increases.
- Northwest: In the Columbia Basin, trade remained slow with light to moderate demand as an arctic cold blast entered the trade area.
In Montana, rancher-to-rancher sales comprised most of the hay sales. Large hay producers continued to sit on large inventories, seemingly content to wait as drought conditions were starting to increase. Mild weather to end 2023 curbed demand.
In Idaho, trade remained slow with light to moderate demand.
In Colorado, trade activity was light on moderate demand. Retail and stable hay sold mostly steady.
In Wyoming, hay sold steady on a thin test; demand was mostly light. Several reports suggest there are piles of low- and high-quality hay remaining to be sold.
- Midwest: In Nebraska, all reported hay sales sold steady. Demand was light to moderate as most livestock owners had adequate supplies, making a price surge unlikely. Strongest demand was for the products going through the hay grinders at feedlots and backgrounding lots.
In Kansas, demand remained low and prices were steady. With colder weather and winter storms rolling in, producers were expecting an increase in movement over the next few weeks.
In South Dakota, demand was moderate for all types of hay. Dairy operators continued to deal with low milk prices, causing them to balk at offered hay prices. Mild early winter weather helped beef cattle operators stretch forage supplies.
In Illinois, trade was active with good demand. Small squares, large packages and wheat straw all sold higher. Higher undertones were supported by adverse weather forecasts.
In Missouri, the first major winter storm of the year caused some interruptions to hay movement. Where ground was unfrozen, farmers struggled feeding between snow and mud. The supply of hay was light to moderate, demand was moderate to good, and prices were mostly steady.
- East: In Pennsylvania, hay sold mostly $15-$25 higher with good demand.
In Alabama, trade was moderate on moderate supply and demand.
Other things we’re seeing
- Dairy: While U.S. average milk prices and dairy income margins improved somewhat last fall, the first quarter of 2024 is bringing a reversal. The current forecast is for 2024 all-milk prices to average about $20 per hundredweight (cwt), down 60 cents from the 2023 average. Milk production is forecast to increase just 0.7% compared to 2023, due to a reduced average cow inventory for the year and slower growth in output per cow.
- Cattle: The USDA releases its semiannual Cattle report on Jan. 31, updating the number of cattle available for placement during 2024 as well as producer intentions for retaining heifers for the breeding herd. The current outlook suggests higher expected first-half 2024 cattle slaughter, as well as heavier dressed weights. Fed cattle beef prices for 2024 are projected at about $178 per cwt, up about $2.50 from the 2023 average.
- Fuel: Fuel prices were lower to start the new year, according to the U.S. Energy Information Administration (EIA). The U.S. retail price for regular-grade gasoline averaged $3.07 per gallon on Jan. 8, down almost 2 cents from the previous week and 19 cents from a year earlier. The average U.S. on-highway price of diesel was $3.83 per gallon, about a nickel per gallon below the prior week and 72 cents less than early January 2023. With increased U.S. crude oil production, gasoline prices are forecast to average around $3.40 per gallon in 2024, compared with an average of more than $3.50 per gallon in 2023.
- Trucking: With the seasonal Asian import slowdown, freight demand is typically lower. Spot flatbed prices trended higher to start January, up 3 cents from December and averaging $2.45 per mile nationally, according to DAT Trendlines. Regionally, average spot prices per mile were: Southeast – $2.50, Midwest – $2.67, South – $2.30, Northeast – $2.46 and West – $2.21.
- Interest rates: The Federal Reserve Board was scheduled to meet on Jan. 30-31 and has hinted that they expect to make three quarter-point rate cuts in 2024, possibly beginning in the summer.