The U.S. milk production per capita for 2023 was 677.3 pounds, down 3.5 pounds (-0.5%) compared with 2022. Table 1 lists the top 25 states states in descending order based on 2023 per capita production. Nine of the top 10 states in total production are also in the top 10 in per capita production, Texas was the only state of the 10 that wasn't.

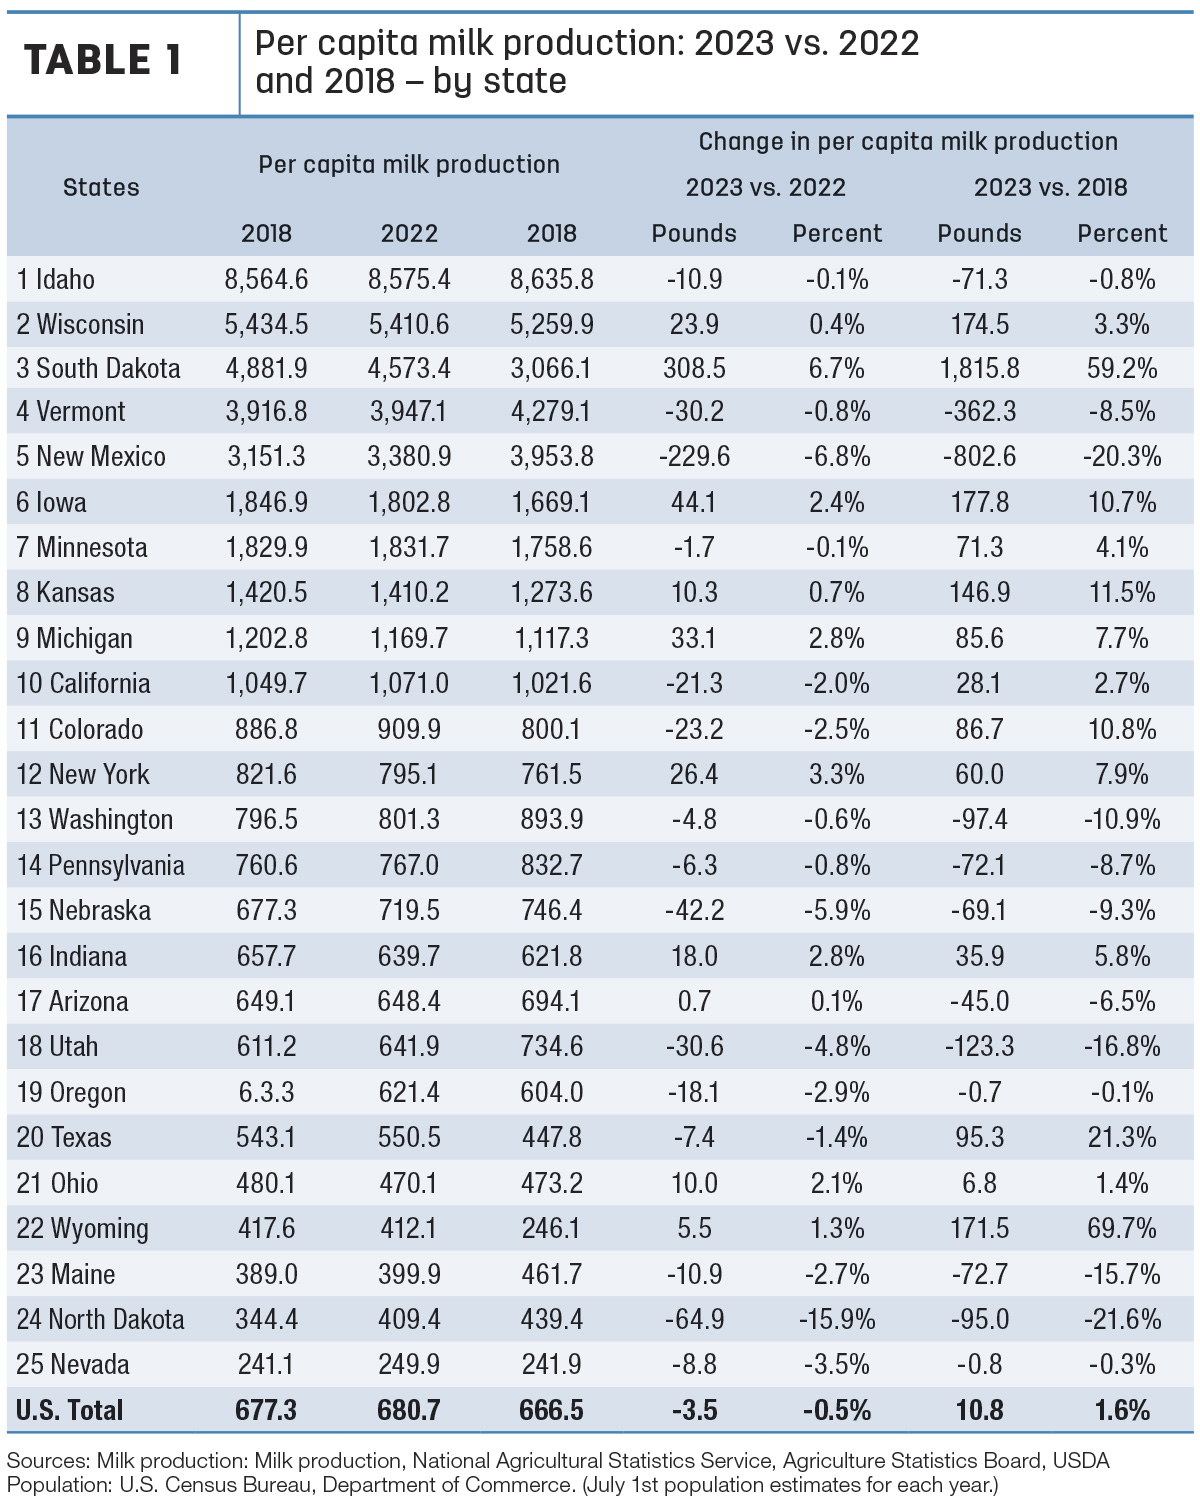
The top five states with the highest milk production per capita were Idaho, Wisconsin, South Dakota, Vermont and New Mexico, respectively, and all five were above 3,000 pounds. The lowest five states were New Jersey, Rhode Island, Alabama, Alaska and Hawaii, and each were below 10 pounds.
Twelve states reported annual per capita increases during 2023, with Alaska and Hawaii's 30.3% increase as the largest gain. South Dakota posted the second-largest increase, with a production per capita gain of 6.7%. Arkansas's per capita production decreased by 27.2%, which was the largest decline. Four other states recorded decreases over 10%: Mississippi (-17.8%), North Dakota (-15.9%), Alabama (-13.1%) and West Virginia (-11.7%).
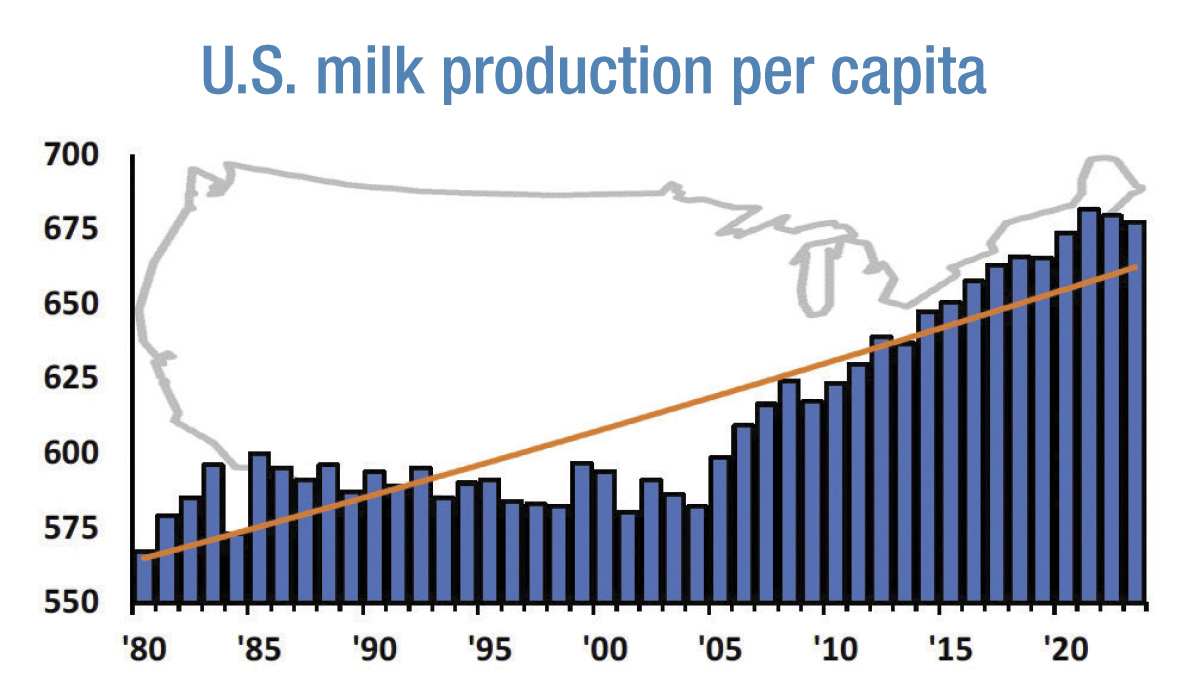
The 300- and 600-pound levels of per capita production are arbitrary divisions selected for this map. The 600-pound level roughly approximates annual per capita consumption of all dairy products on a milk equivalent basis, while the 300-pound level reflects average annual consumption of Class I and Class II products (fluid and soft manufactured products), plus reserve requirements. A cursory analysis of regional milk supply conditions can be performed by examining the shading patterns prevalent in the individual regions.
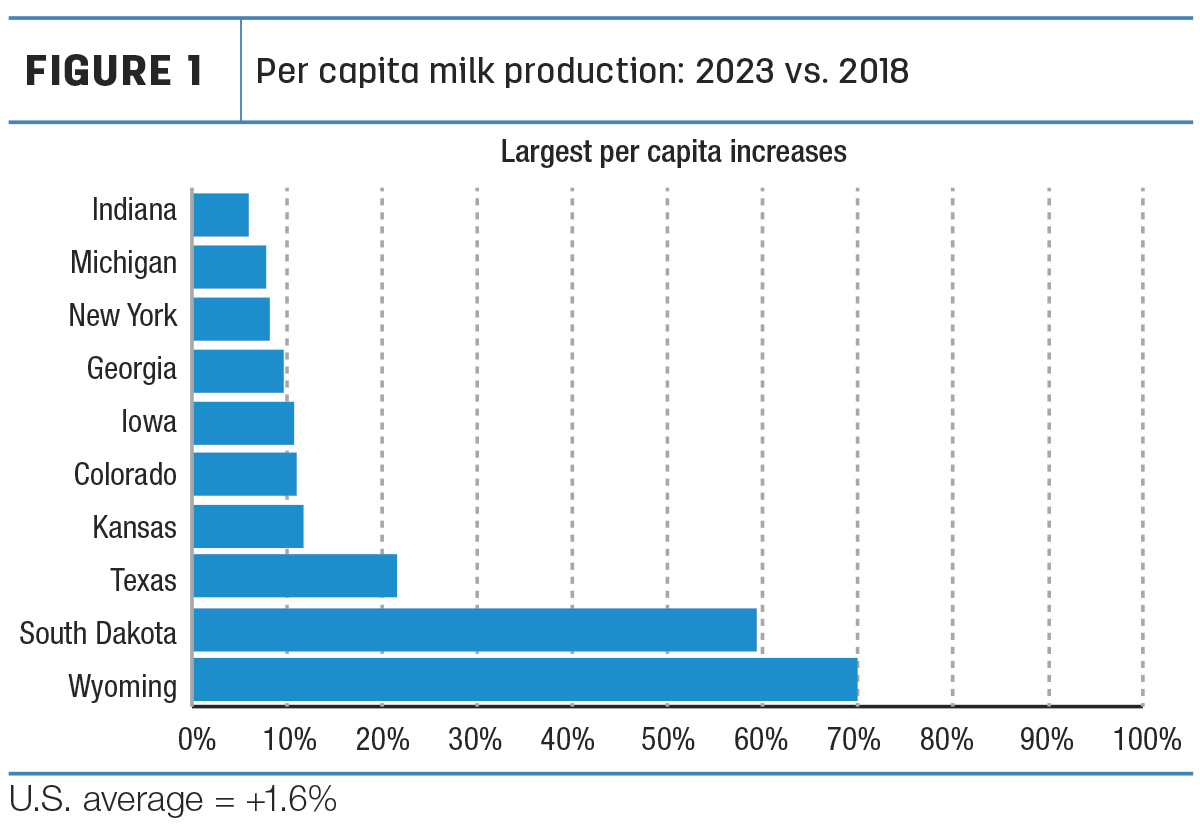
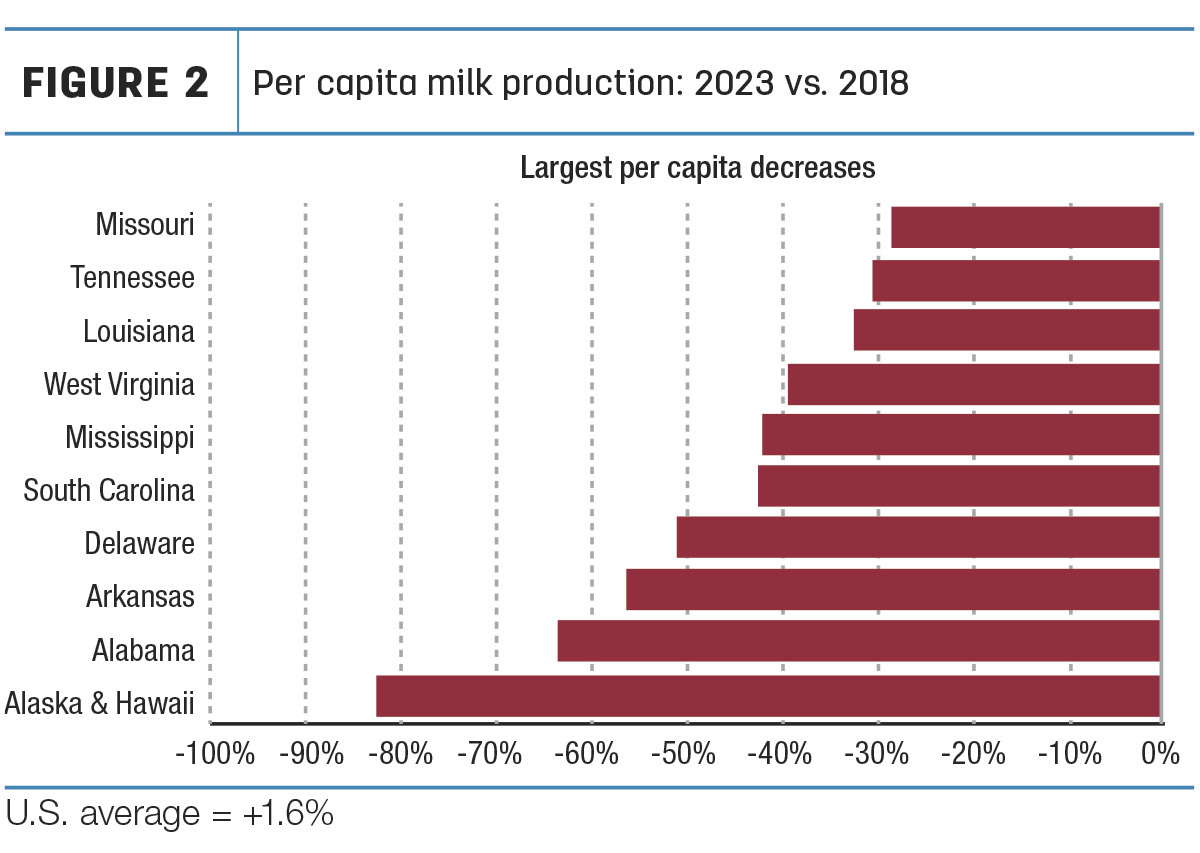
Per capita production for the U.S. increased by 10.8 pounds (+1.6%) in the last five years between 2018 and 2023. Fourteen states recorded increases in per capita milk production, led by Wyoming's 69.7% gain (Figure 1). Five additional states increased per capita production by 10% or more comparing 2023 with 2018. Alaska & Hawaii's combined total recorded the largest decrease, with per capita production falling by 82.4% (Figure 2). Fifteen additional states posted declines of more than 20%, while eight states reported decreases between 10% and 20%.
Source: Central Order Marketing Service Bulletin for February 2024, 2023 Milk Production (2023 vs. 2018)